States of Italy

This example shows how to get data from a source and plot it using GeoMakie. It's more to show how to hybridize two data sources than anything else.
using CairoMakie, GeoMakie
using GADM, DataFrames
import GeometryOps as GO
Acquire the data via GADM.jl, a package which allows access to the GADM dataset of country border geometries. We'll get the 1st level of detail, which provides the admin-1 (state) borders.
ita_df = GADM.get("ITA"; depth = 1) |> DataFrameWe can also calculate the centroid of Italy from this data!
Choosing a projection for the map is important, of course, and for a country like Italy, we can get away with an orthographic projection, which is kind of like an overhead view from a great distance.
We can center this orthographic projection at the centroid of Italy, so that distortion is minimized.
ita_centroid = GO.centroid(ita_df.geom)

fig = Figure()
ga = GeoAxis(
    fig[1, 1];
    dest = "+proj=ortho +lon_0=$(ita_centroid[1]) +lat_0=$(ita_centroid[2])"
)
poly!(
    ga, ita_df.geom;
    color = 1:size(ita_df, 1), # this could be any vector of length `size(ita_df, 1)`
    strokecolor = :blue, strokewidth = 1, shading = NoShading
    )
fig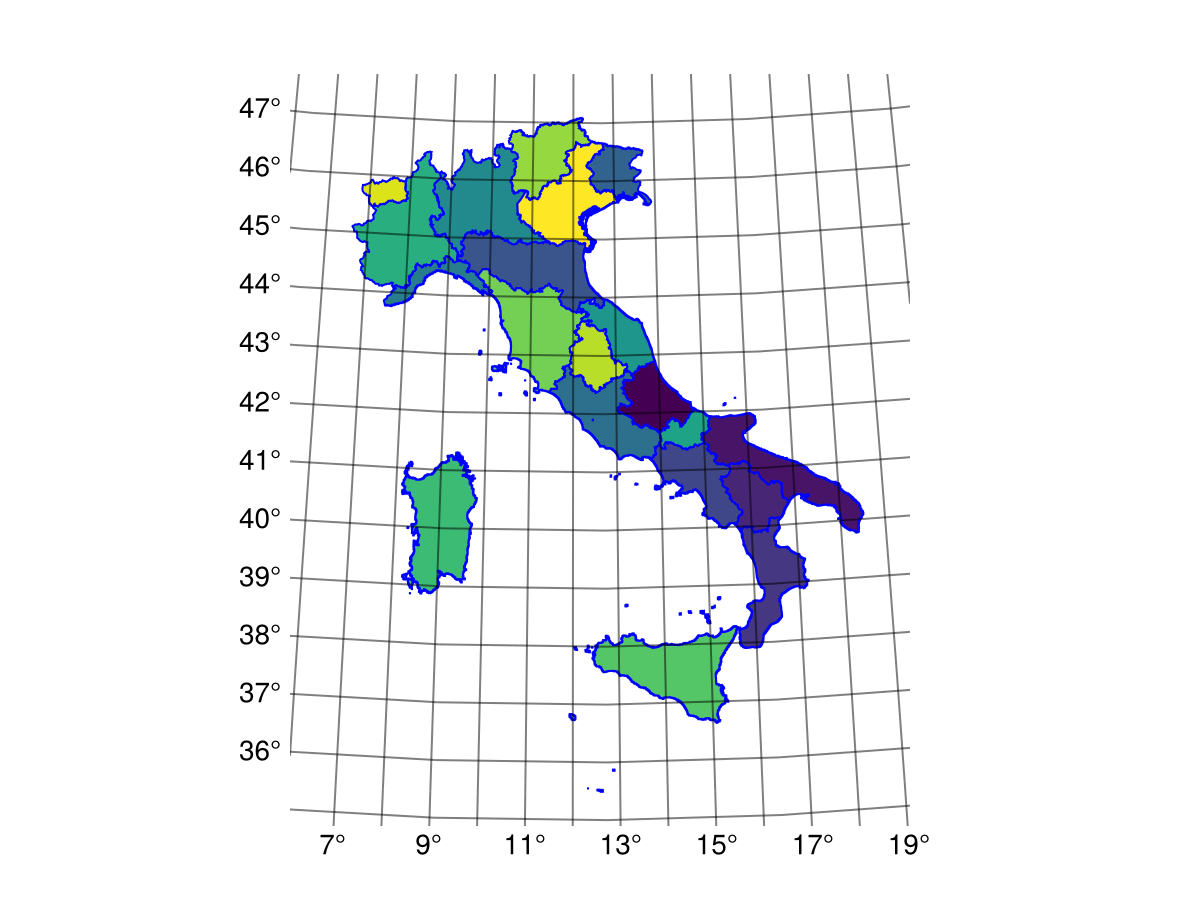
That looks like a lot of ticks. Let's simplify the grid:
ga.xticks = Makie.WilkinsonTicks(5; k_min = 3)
ga.yticks = Makie.WilkinsonTicks(10; k_min = 5)
fig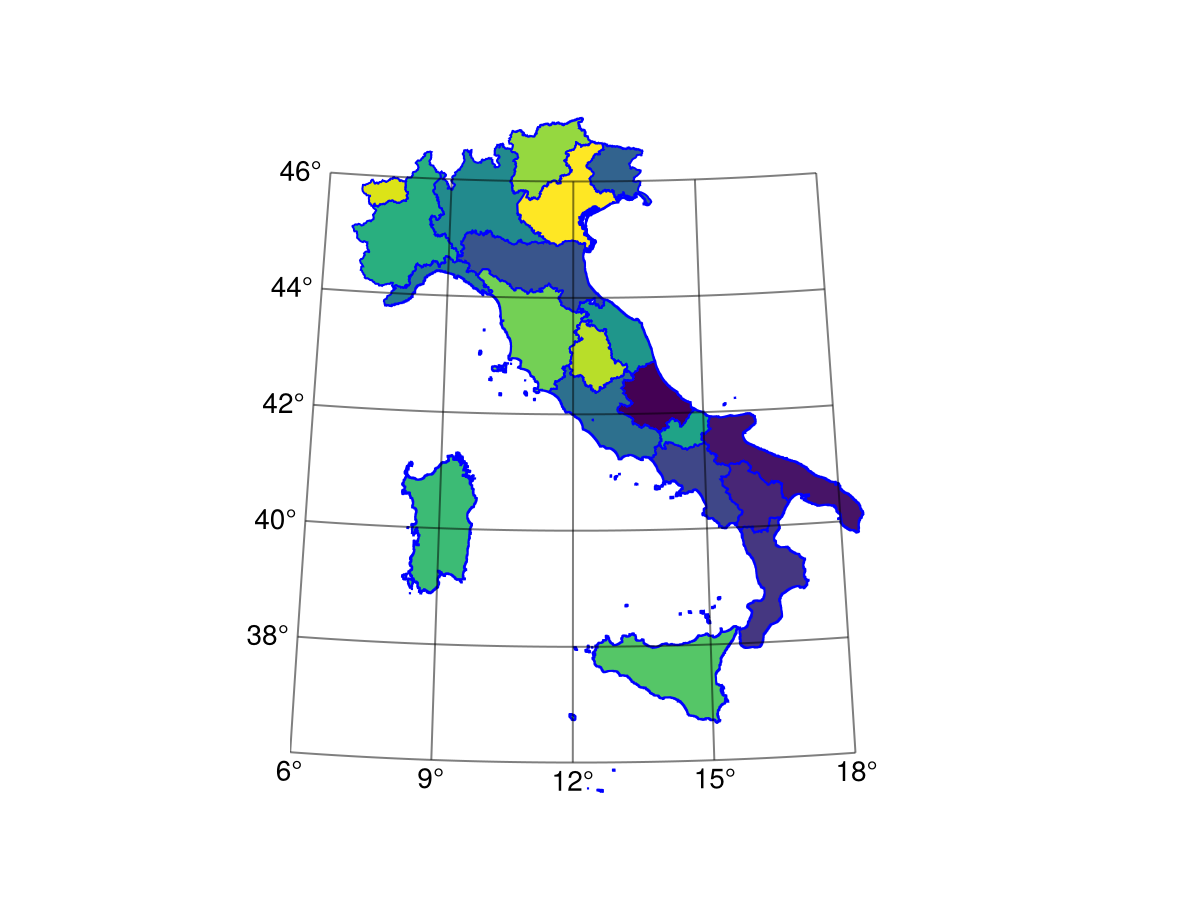
Whoops, this doesn't cover the whole of Italy! No worries, we'll have a spine eventually to show this.
This page was generated using Literate.jl.