Basic examples
julia
using GeoMakie, CairoMakie # you could use GLMakie too

lons = -180:180
lats = -90:90-90:90Create some field of values across lons and lats This grid can be of any density, but note that the time it takes to plot scales with the grid size!
julia
field = [exp(cosd(l)) + 3(y/90) for l in lons, y in lats]361×181 Matrix{Float64}:
-2.63212 -2.59879 -2.56545 … 3.26788 3.30121 3.33455 3.36788
-2.63206 -2.59873 -2.5654 3.26794 3.30127 3.3346 3.36794
-2.6319 -2.59856 -2.56523 3.2681 3.30144 3.33477 3.3681
-2.63162 -2.59828 -2.56495 3.26838 3.30172 3.33505 3.36838
-2.63122 -2.59789 -2.56456 3.26878 3.30211 3.33544 3.36878
-2.63072 -2.59738 -2.56405 … 3.26928 3.30262 3.33595 3.36928
-2.6301 -2.59677 -2.56343 3.2699 3.30323 3.33657 3.3699
-2.62937 -2.59603 -2.5627 3.27063 3.30397 3.3373 3.37063
-2.62852 -2.59519 -2.56186 3.27148 3.30481 3.33814 3.37148
-2.62756 -2.59423 -2.5609 3.27244 3.30577 3.3391 3.37244
⋮ ⋱ ⋮
-2.62852 -2.59519 -2.56186 3.27148 3.30481 3.33814 3.37148
-2.62937 -2.59603 -2.5627 3.27063 3.30397 3.3373 3.37063
-2.6301 -2.59677 -2.56343 3.2699 3.30323 3.33657 3.3699
-2.63072 -2.59738 -2.56405 … 3.26928 3.30262 3.33595 3.36928
-2.63122 -2.59789 -2.56456 3.26878 3.30211 3.33544 3.36878
-2.63162 -2.59828 -2.56495 3.26838 3.30172 3.33505 3.36838
-2.6319 -2.59856 -2.56523 3.2681 3.30144 3.33477 3.3681
-2.63206 -2.59873 -2.5654 3.26794 3.30127 3.3346 3.36794
-2.63212 -2.59879 -2.56545 … 3.26788 3.30121 3.33455 3.36788Surface example
julia
fig = Figure()
ax = GeoAxis(fig[1,1])
sp = surface!(ax, lons, lats, field; shading = NoShading)
fig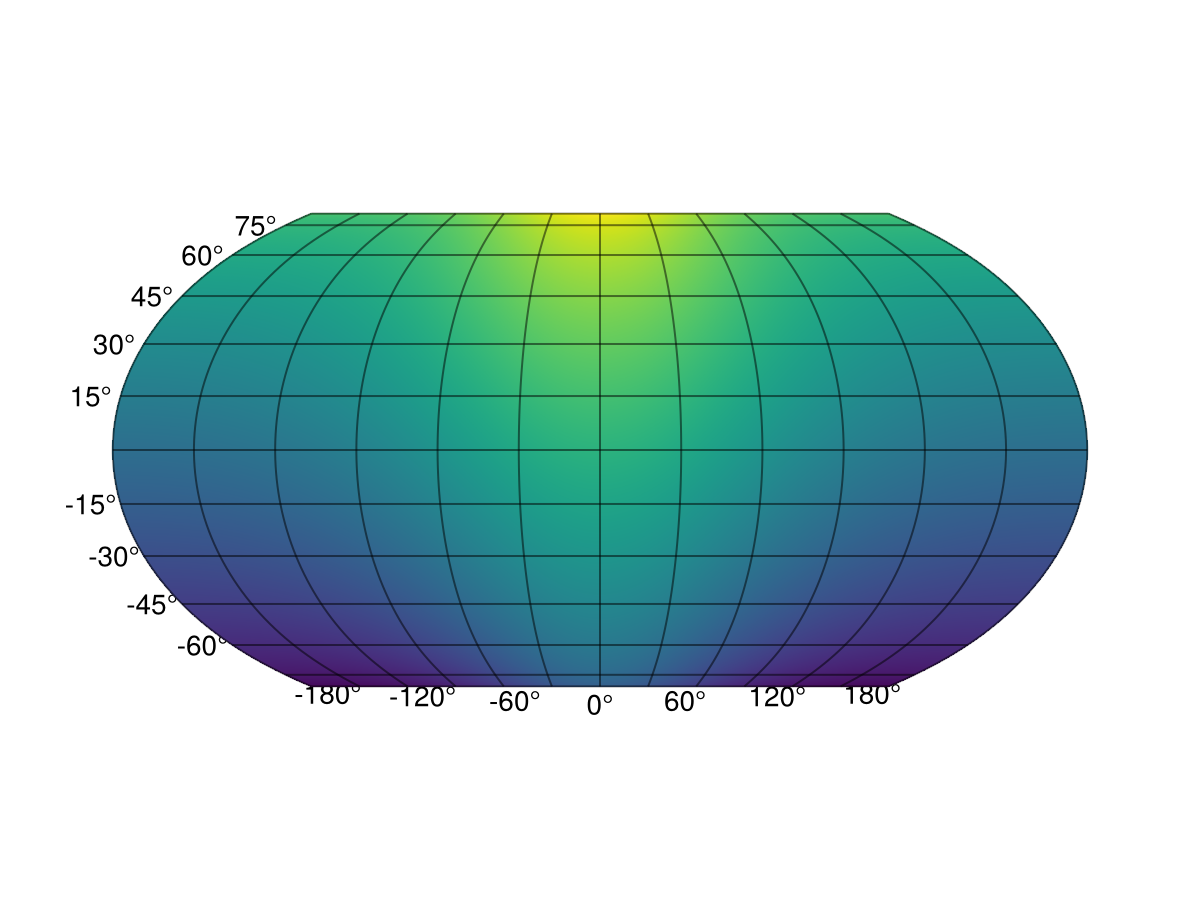
To save your plot, run e.g. save("surf_example.png", fig; px_per_unit=2).
Each backend saves differently - GLMakie and WGLMakie save as images, but CairoMakie can be used to save PDFs and SVGs as well.
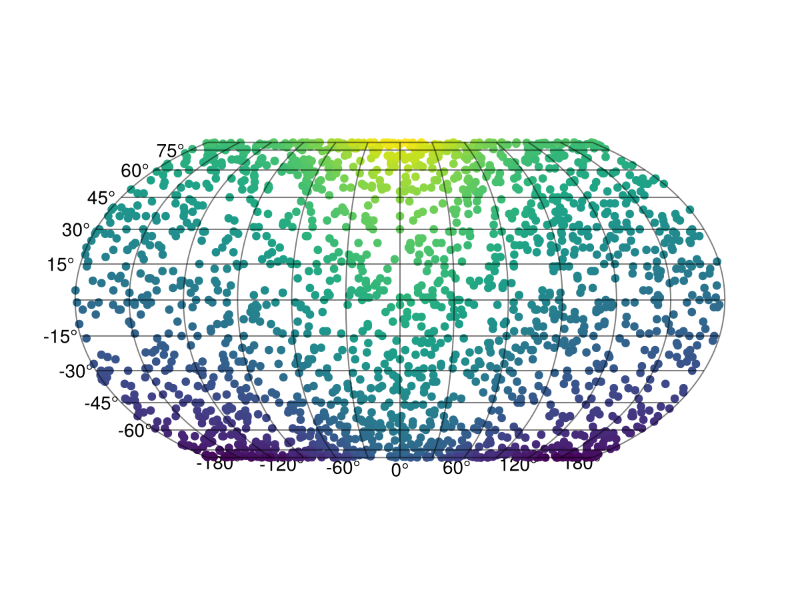
julia
# Scatter example
slons = rand(lons, 2000)
slats = rand(lats, 2000)
sfield = [exp(cosd(l)) + 3(y/90) for (l,y) in zip(slons, slats)]

fig = Figure()
ax = GeoAxis(fig[1,1])
scatter!(slons, slats; color = sfield)
fig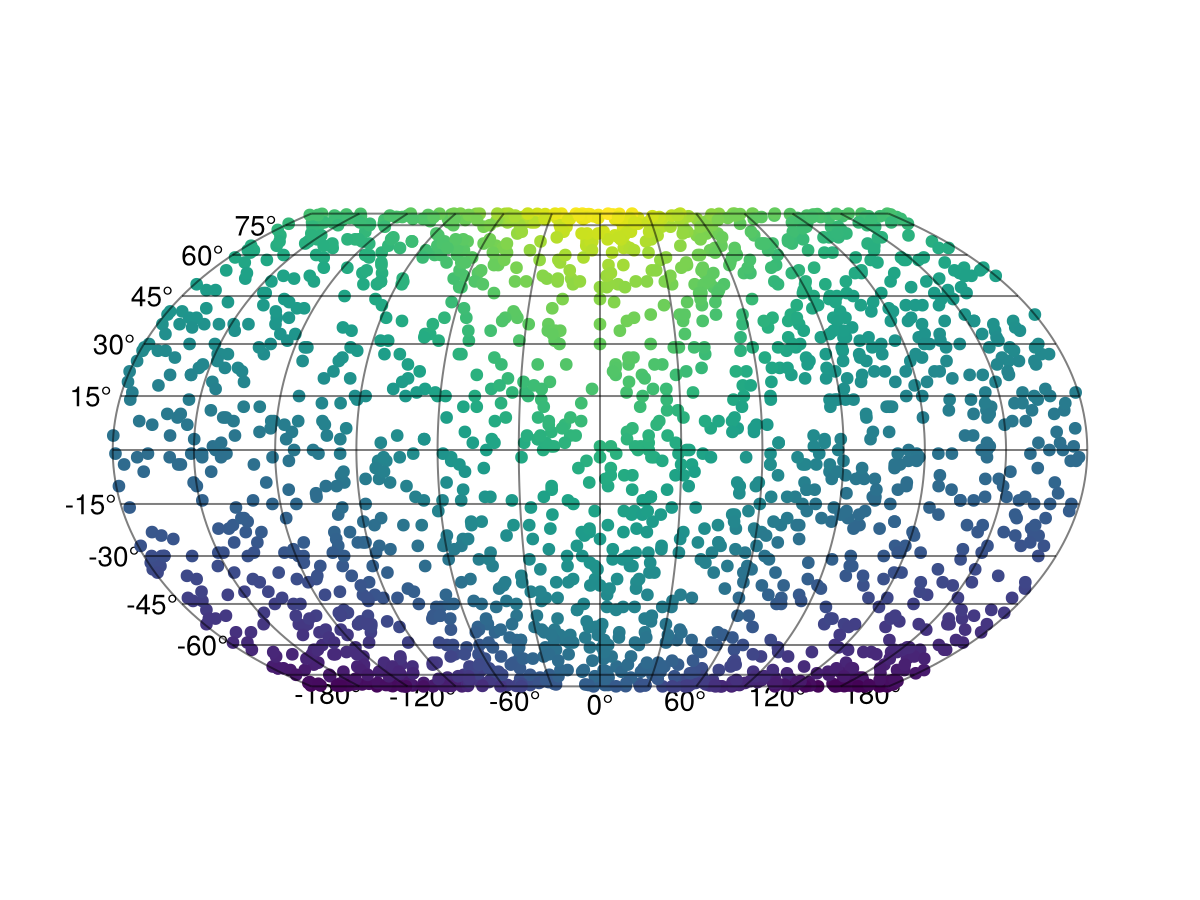
Again, to save, run e.g. save("scatter_example.png", fig; px_per_unit=2).
This page was generated using Literate.jl.