Graphs on maps
Any Makie recipe can be plotted onto a GeoAxis``, and this includes recipes like GraphMakie'sgraphplot`, complex though it may be!
In this example, we'll show how to plot a graph onto a choropleth map (it's really as simple as plotting it onto a normal Axis, just using a GeoAxis instead).
This example was adapted from code in this Julia Discourse post.
using GeoMakie, CairoMakie
using GraphMakie, GraphMakie.Graphs
using NaturalEarth, DataFrames
We get US state borders from Natural Earth, and filter it out so it's only the continental states. For the purposes of this example, we only care about those.
admin_1_df = DataFrame(naturalearth("admin_1_states_provinces", 110))First, filter out everything that's not in the USA:
filter!(:gu_a3 => ==("USA"), admin_1_df)Get rid of Alaska, Hawaii and Puerto Rico. so we just have the continental US.
filter!(:name_en => ∉(("Alaska", "Hawaii", "Puerto Rico")), admin_1_df)
admin_1_df.geometry = GeoMakie.to_multipoly.(admin_1_df.geometry)
n = size(admin_1_df, 1)49In this case, the graph is a linkage from city to city, so we'll use the lat/long of each city as the position.
gpos = Dict(
    (-96.5967, 38.9617) => "KSCYng",
    (-122.3, 47.6) => "STTLng",
    (-105.0, 40.75) => "DNVRng",
    (-122.026, 37.3858) => "SNVAng",
    (-87.6167, 41.8333) => "CHINng",
    (-85.5, 34.5) => "ATLAng",
    (-77.0268, 38.8973) => "WASHng",
    (-73.9667, 40.7833) => "NYCMng",
    (-86.1595, 39.7806) => "IPLSng",
    (-95.5174, 29.77) => "HSTNng",
    (-118.25, 34.05) => "LOSAng",
    (-84.3833, 33.75) => "ATLAM5"
)
Dict{Tuple{Float64, Float64}, String} with 12 entries:
(-122.026, 37.3858) => "SNVAng"
(-73.9667, 40.7833) => "NYCMng"
(-95.5174, 29.77) => "HSTNng"
(-96.5967, 38.9617) => "KSCYng"
(-122.3, 47.6) => "STTLng"
(-105.0, 40.75) => "DNVRng"
(-87.6167, 41.8333) => "CHINng"
(-77.0268, 38.8973) => "WASHng"
(-85.5, 34.5) => "ATLAng"
(-86.1595, 39.7806) => "IPLSng"
(-118.25, 34.05) => "LOSAng"
(-84.3833, 33.75) => "ATLAM5"From this Dict, we create a "complete", fully-connected graph. This means that each vertex is connected to each other vertex.
g = complete_graph(length(keys(gpos))){12, 66} undirected simple Int64 graphThe positions here are just the lat/long of each city, in the order they were added to the graph.
positions = Point2f.(collect(keys(gpos)))12-element Vector{GeometryBasics.Point{2, Float32}}:
[-122.026, 37.3858]
[-73.9667, 40.7833]
[-95.5174, 29.77]
[-96.5967, 38.9617]
[-122.3, 47.6]
[-105.0, 40.75]
[-87.6167, 41.8333]
[-77.0268, 38.8973]
[-85.5, 34.5]
[-86.1595, 39.7806]
[-118.25, 34.05]
[-84.3833, 33.75]Now, we create the figure and GeoAxis, in the lcc projection.
fig = Figure(size = (1200, 800), fontsize = 22)
ga = GeoAxis(
    fig[1, 1],
    source = "+proj=longlat +datum=WGS84",
    dest = "+proj=lcc +lon_0=-100 +lat_1=33 +lat_2=45",
    title = "Projection: lcc +lon_0=-100 +lat_1=33 +lat_2=45",
)GeoAxis()We plot the USA states as a sort of background material,
poly!(
    ga, admin_1_df.geometry;
    color = 1:n, colormap = (:viridis, 0.25),
    strokecolor = :black, strokewidth = 1
)
fig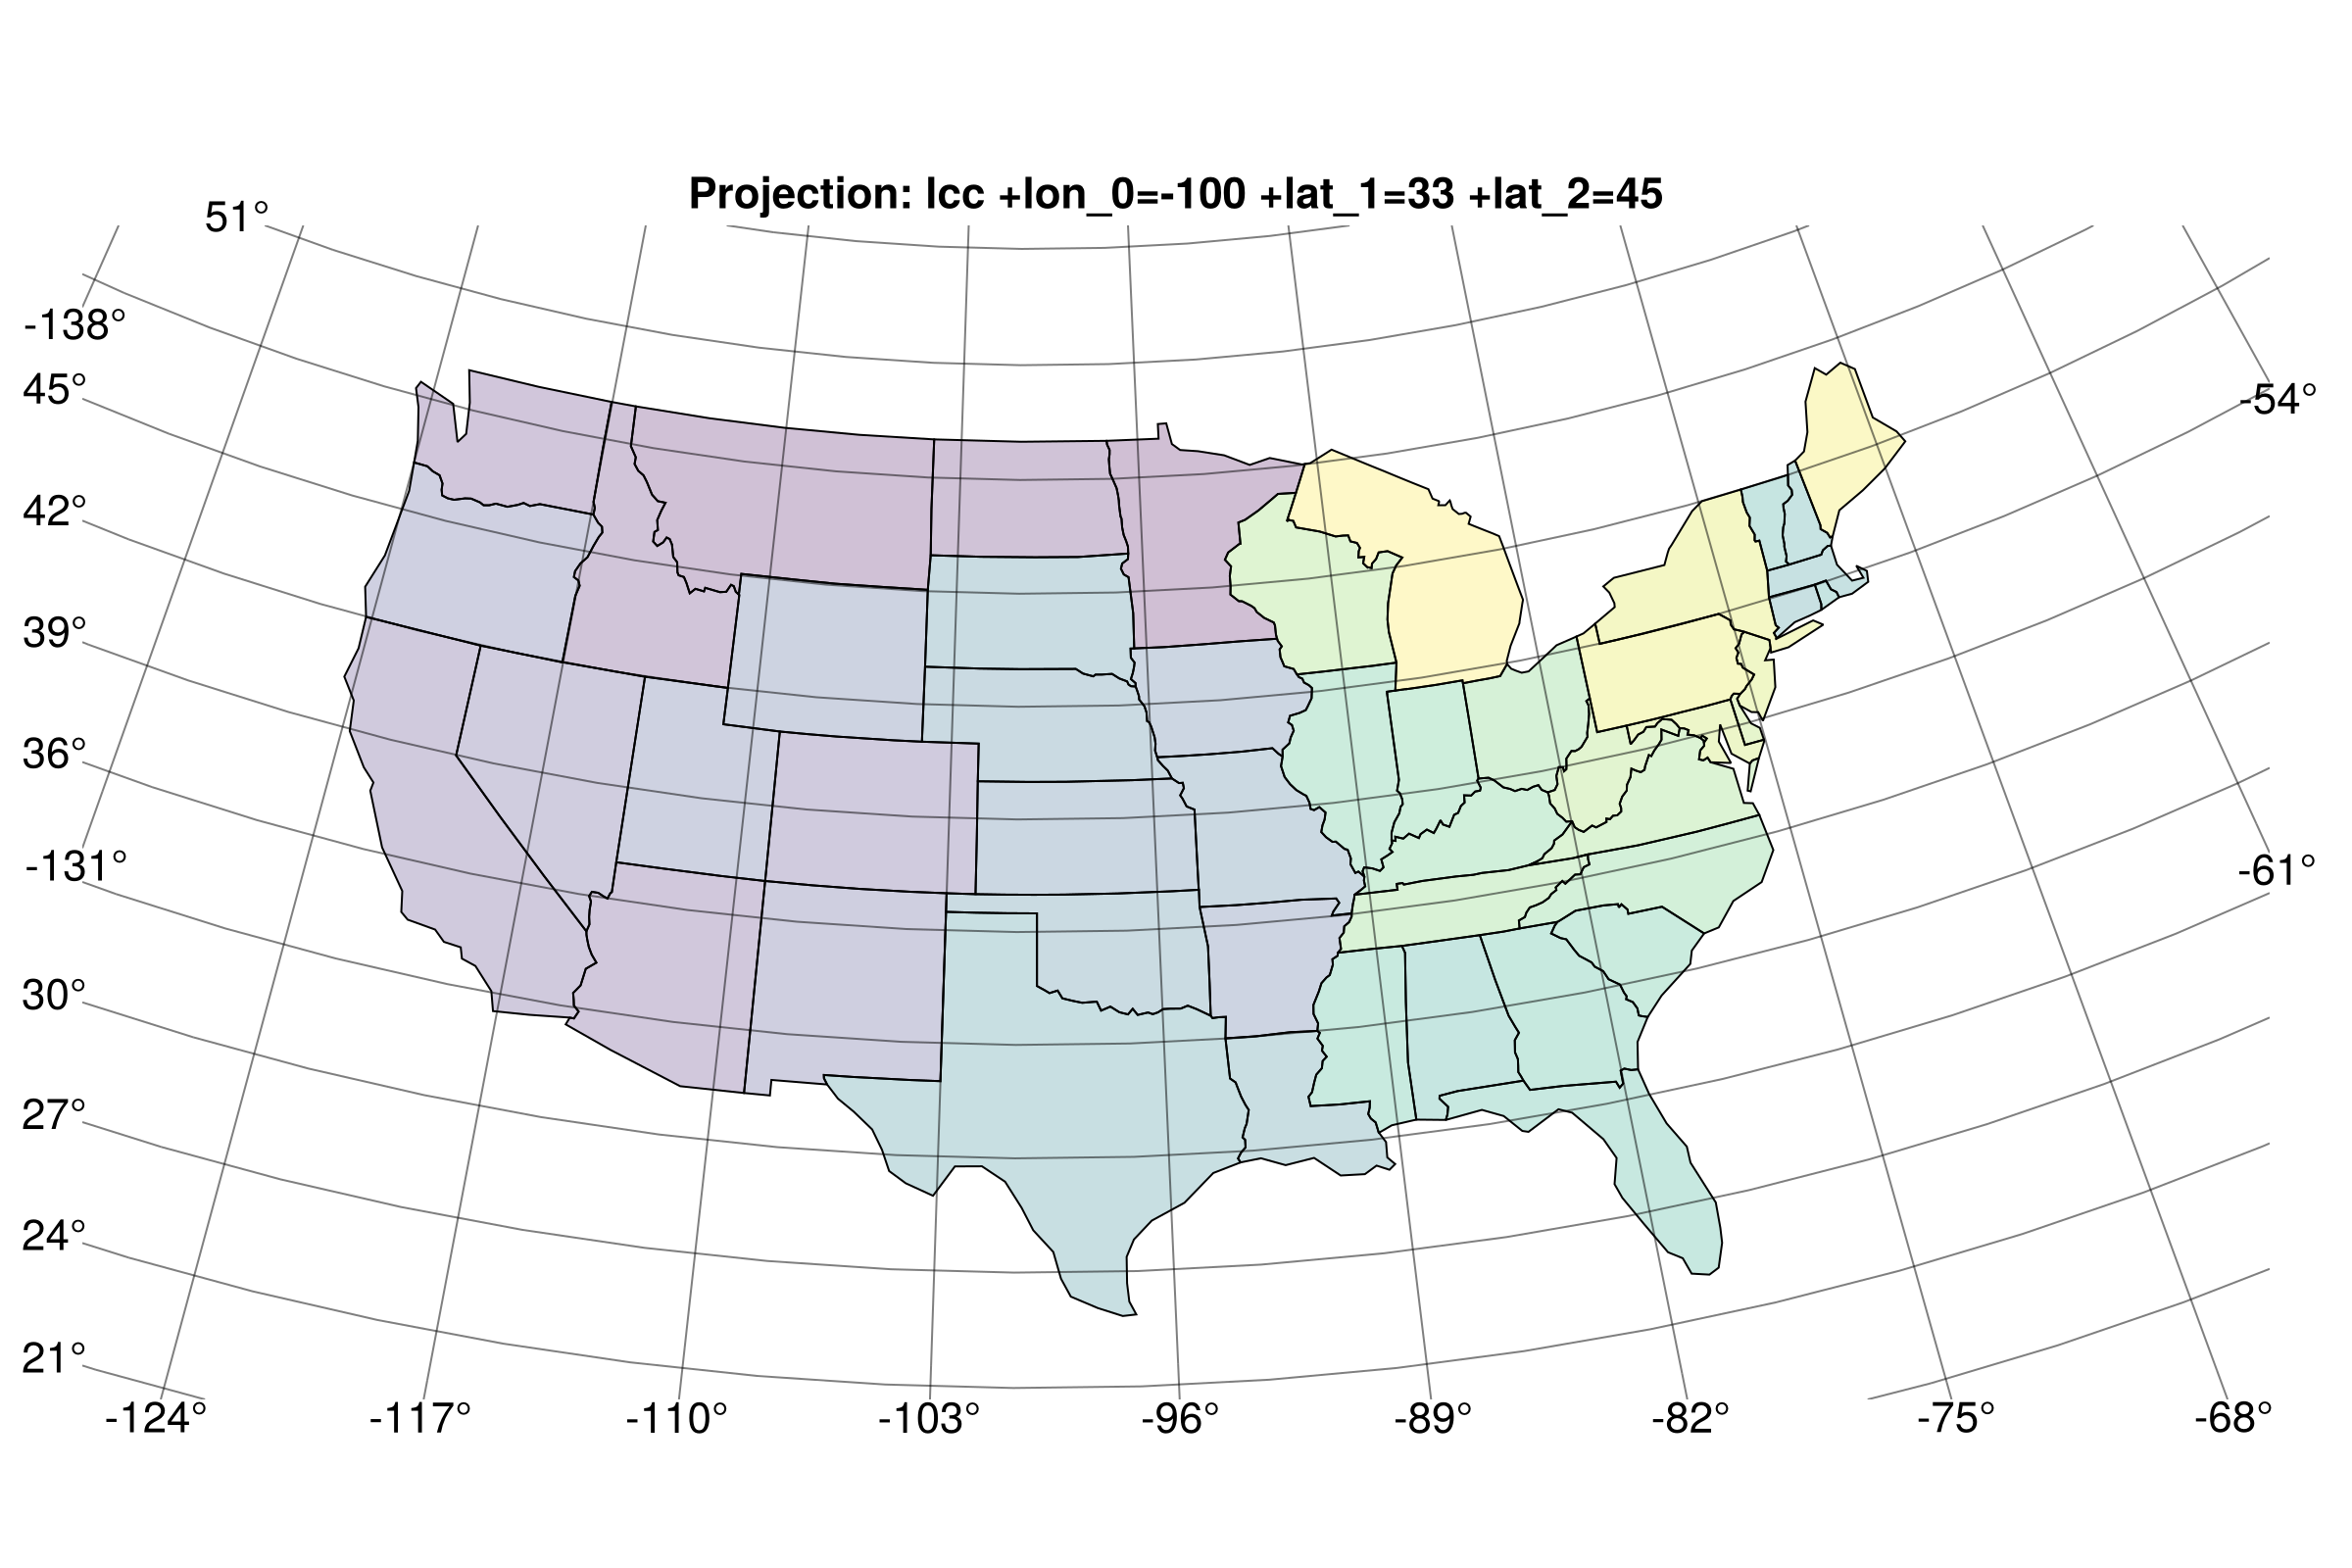
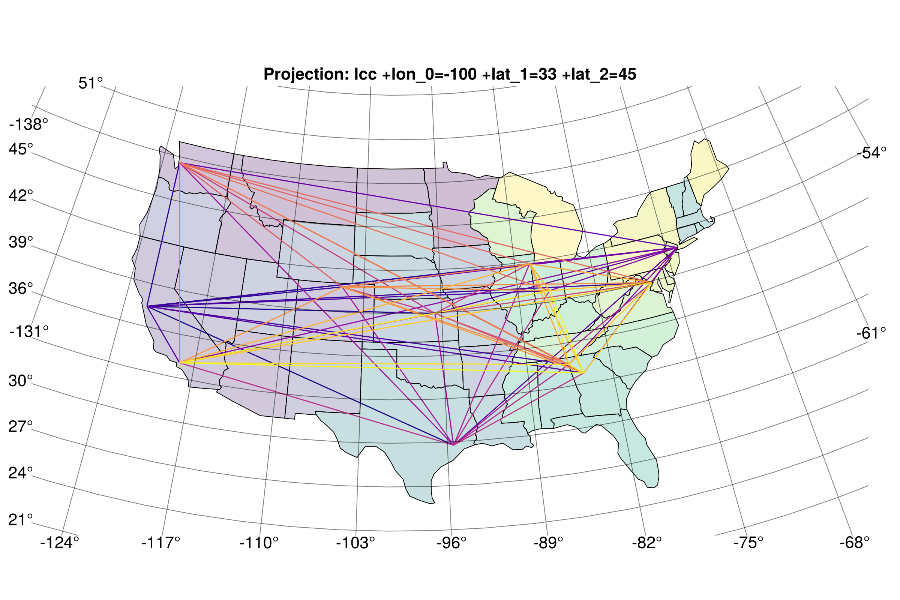
and finally execute the graph plot!
graphplot!(
    ga, g;
    layout = _ -> positions, node_size = 1,
    edge_color = cgrad(:plasma)[LinRange(0, 1, 66)],
    node_color = cgrad(:plasma)[LinRange(0, 1, length(keys(gpos)))]
)

fig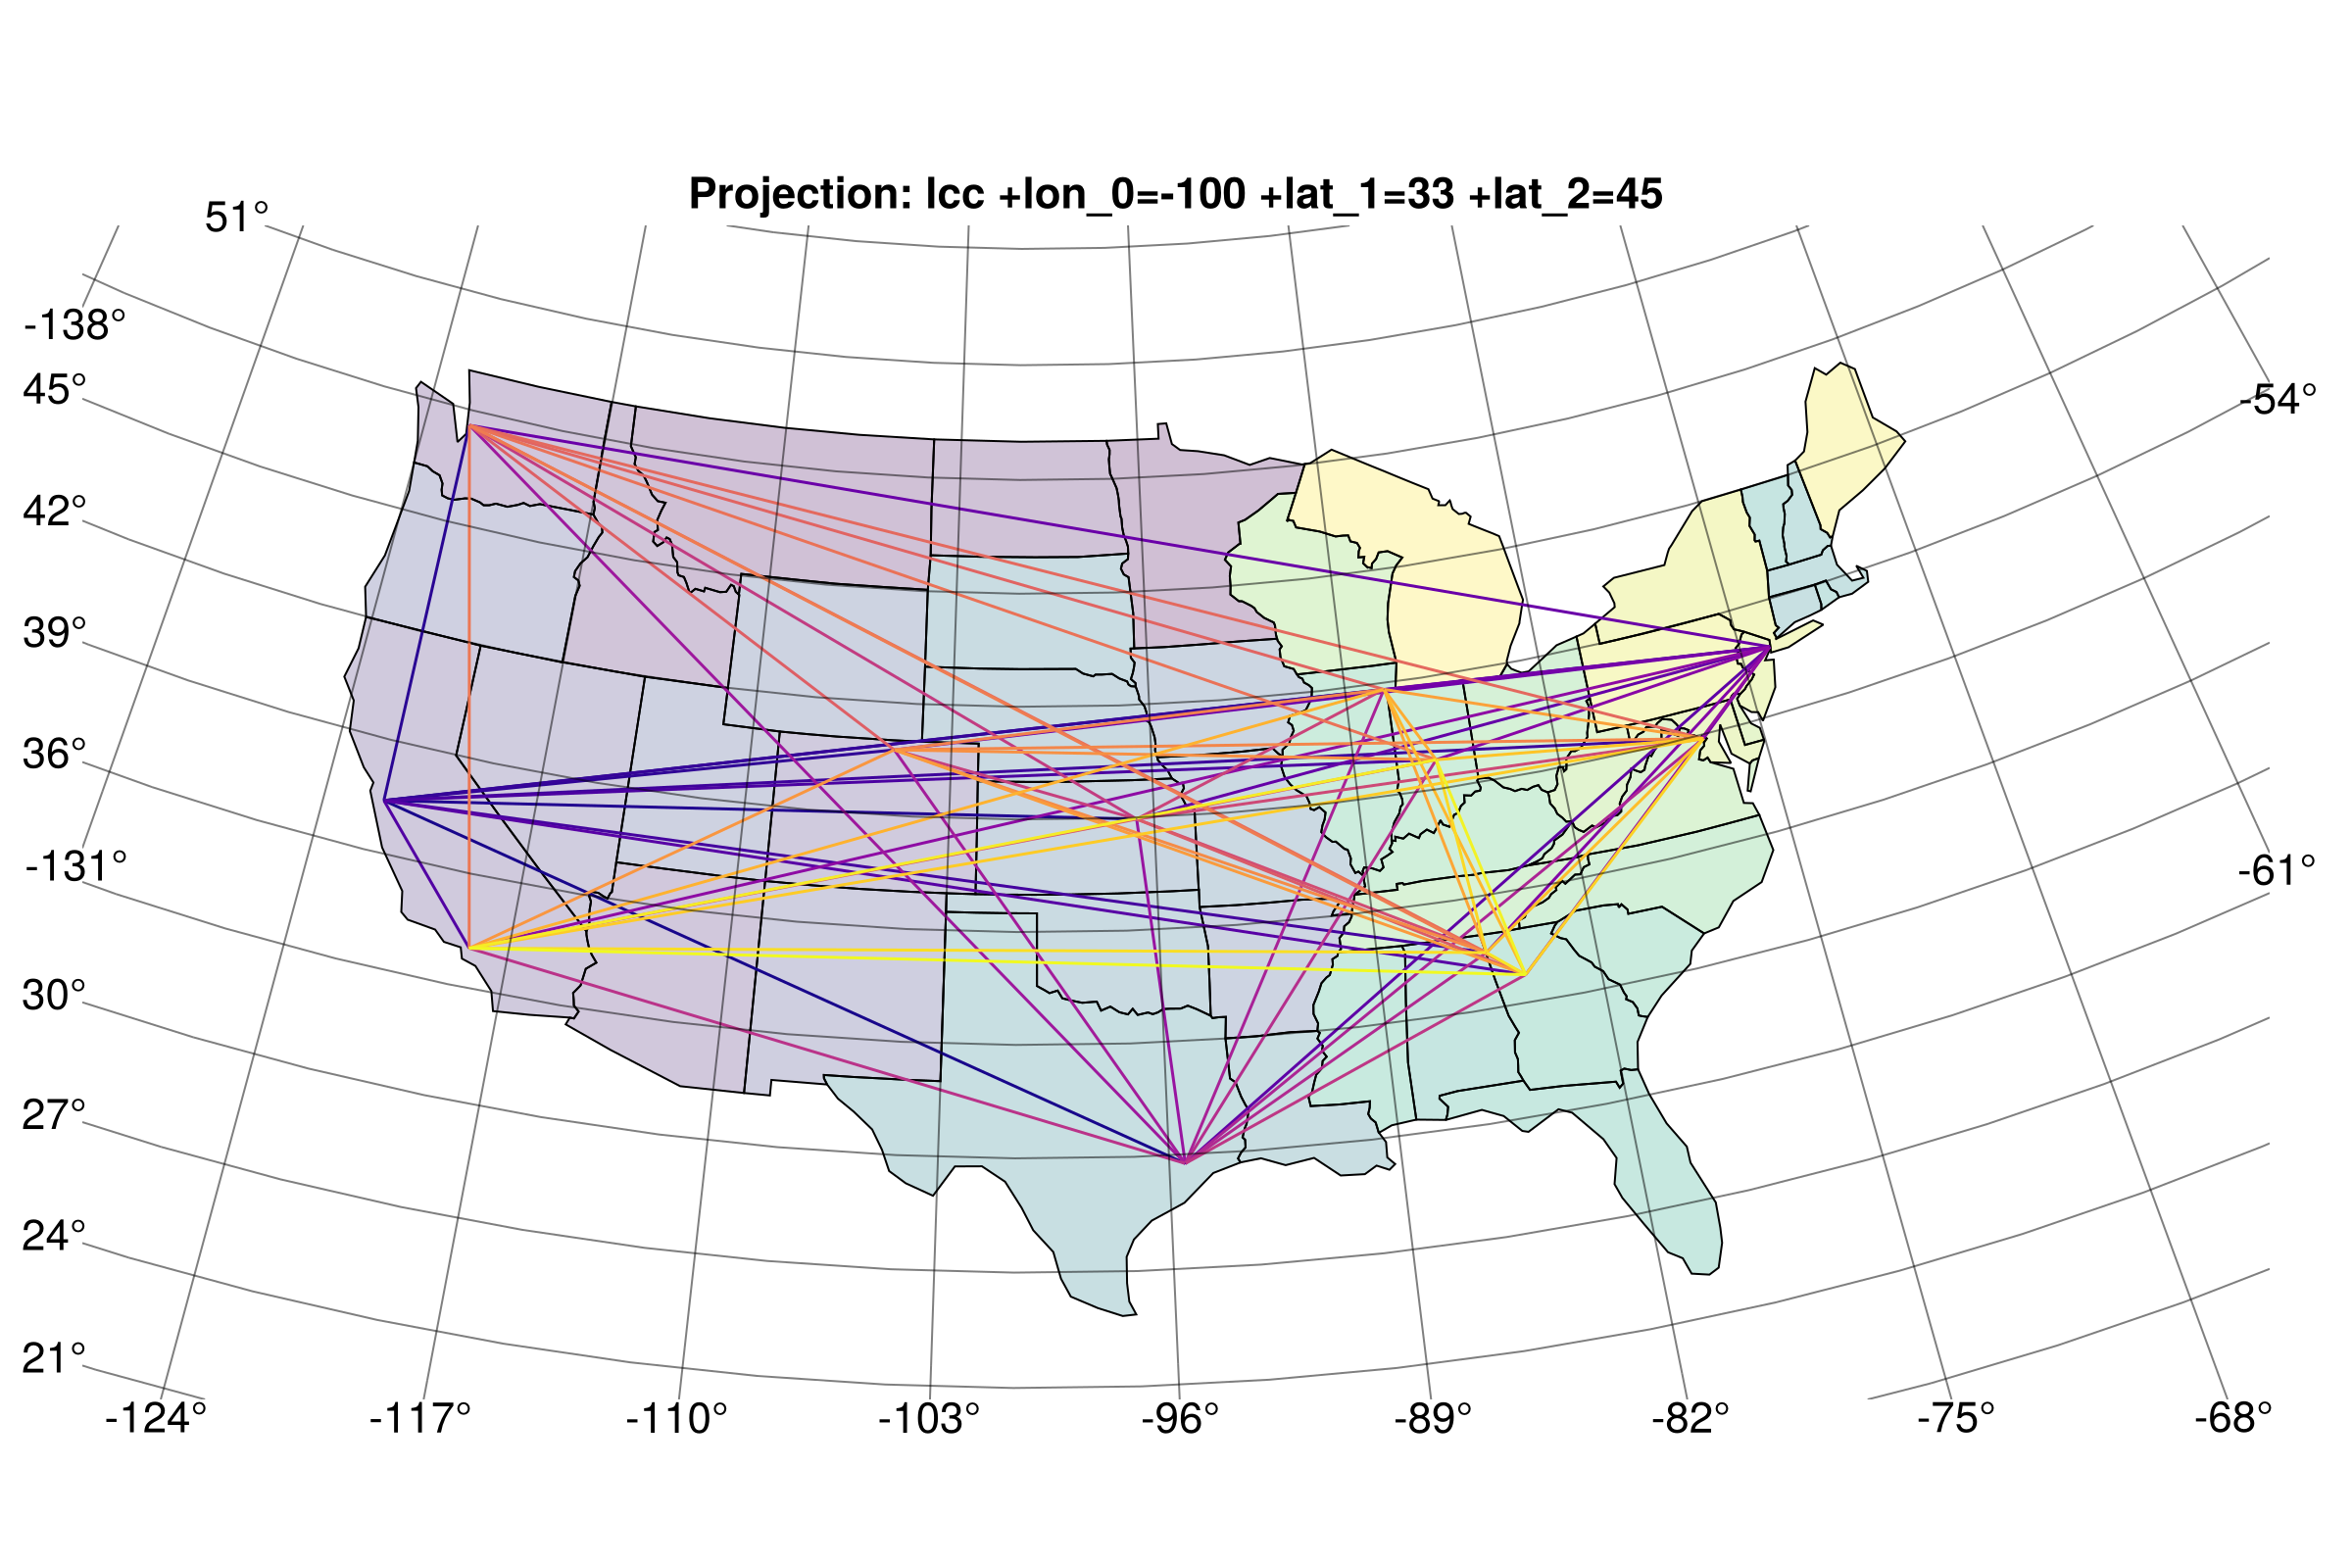
This page was generated using Literate.jl.