Healpix.jl

Healpix.jl is an equal-area "pixelization" of the 2-sphere. Here, we show how to plot a Healpix.jl pixelization via GeoMakie.
This is currently a manual process, but we hope to add recipes soon!
Construct a synthetic Healpix map
julia
using CairoMakie, GeoMakie

using Healpix
nside = 8
m = HealpixMap{Float64, RingOrder}(nside)
m.pixels[:] = 1:length(m.pixels)
m
768-element Healpix.HealpixMap{Float64, Healpix.RingOrder, Vector{Float64}}:
1.0
2.0
3.0
4.0
5.0
6.0
7.0
8.0
9.0
10.0
⋮
760.0
761.0
762.0
763.0
764.0
765.0
766.0
767.0
768.0julia
img, _, _ = Healpix.equirectangular(m)
heatmap(img)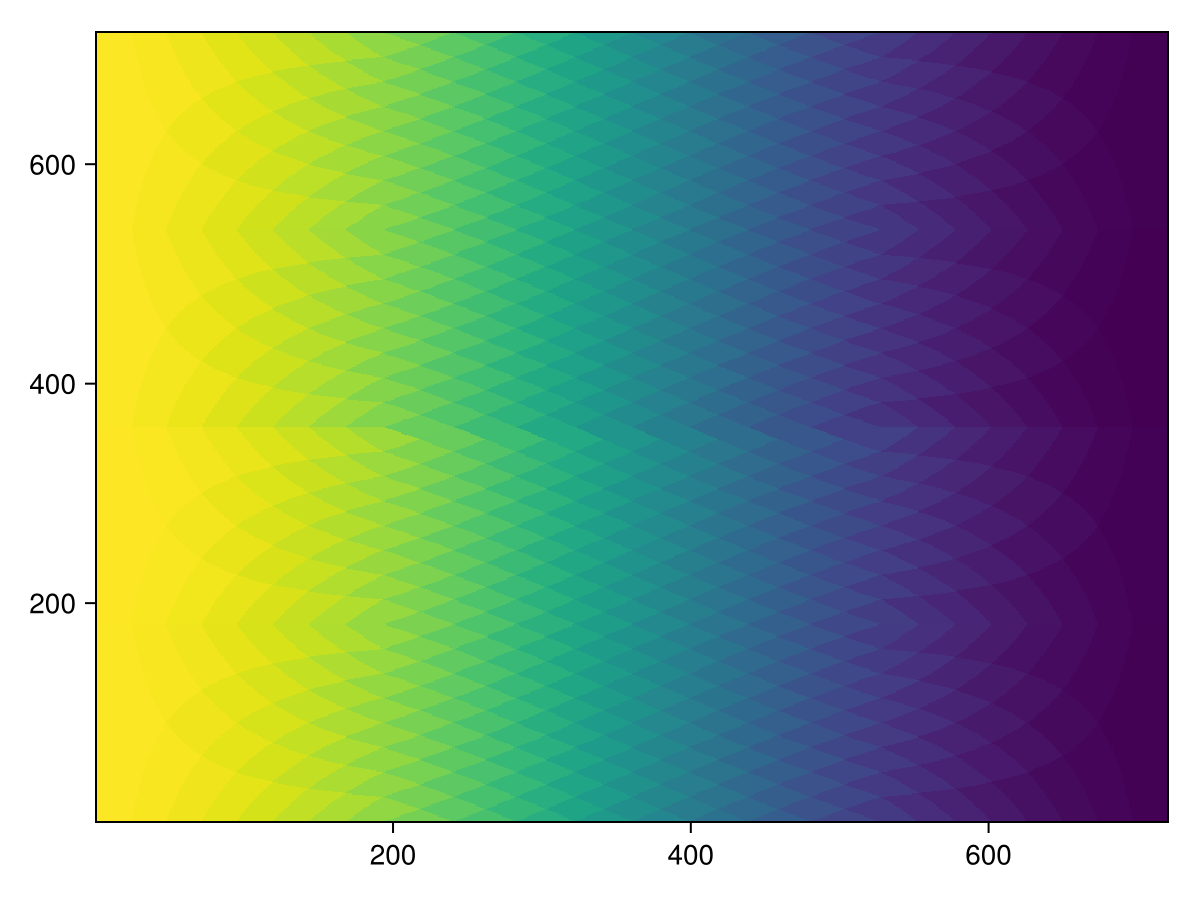
Now we can plot it on a GeoAxis with a Mollweide projection:
julia
meshimage(-180..180, -90..90, reverse(img; dims = 1); npoints = 200, axis = (; type = GeoAxis, dest = "+proj=moll"))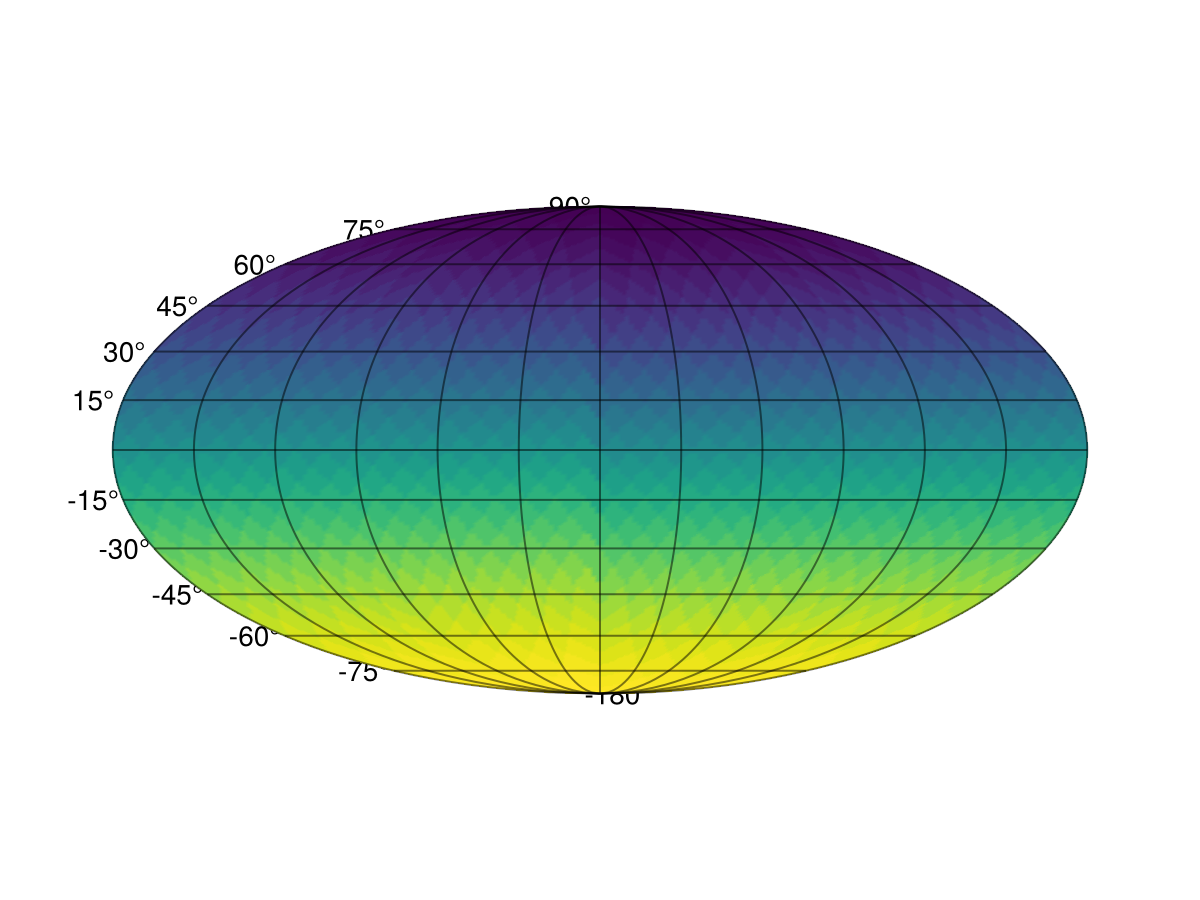
Finally, we can also try to obtain the image as a Mollweide projected image via Healpix, and then plot it directly. For more information on what we're doing here, see the Multiple CRS example.
julia
img, _, _ = Healpix.mollweide(m)
heatmap(img)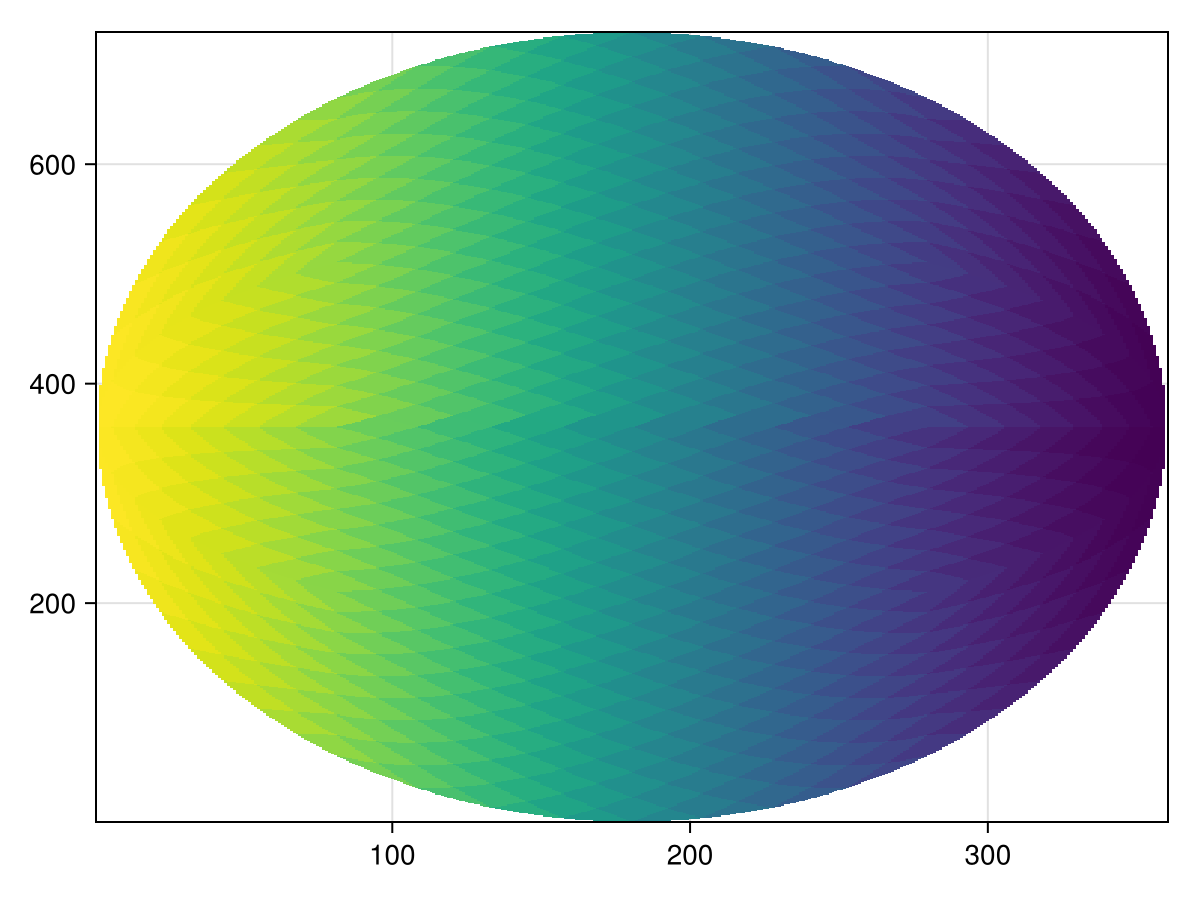
julia
fig = Figure()
ax = GeoAxis(fig[1, 1]; dest = "+proj=moll")
hp_bbox = Makie.apply_transform(ax.transform_func[], Makie.BBox(-180, 180, -90, 90))
GeometryBasics.HyperRectangle{2, Float32}(Float32[-1.8040096f7, -9.020048f6], Float32[3.608019f7, 1.8040096f7])The rectangle above is the bounding box of the full Earth (or sky, in this case) in the Mollweide projection.
julia
mini = minimum(hp_bbox)
maxi = maximum(hp_bbox)
meshimage!(ax, mini[1]..maxi[1], mini[2]..maxi[2], reverse(img; dims = 1); npoints = 200, source = "+proj=moll")
lines!(ax, GeoMakie.coastlines(); color = :black, xautolimits = false, yautolimits = false)
fig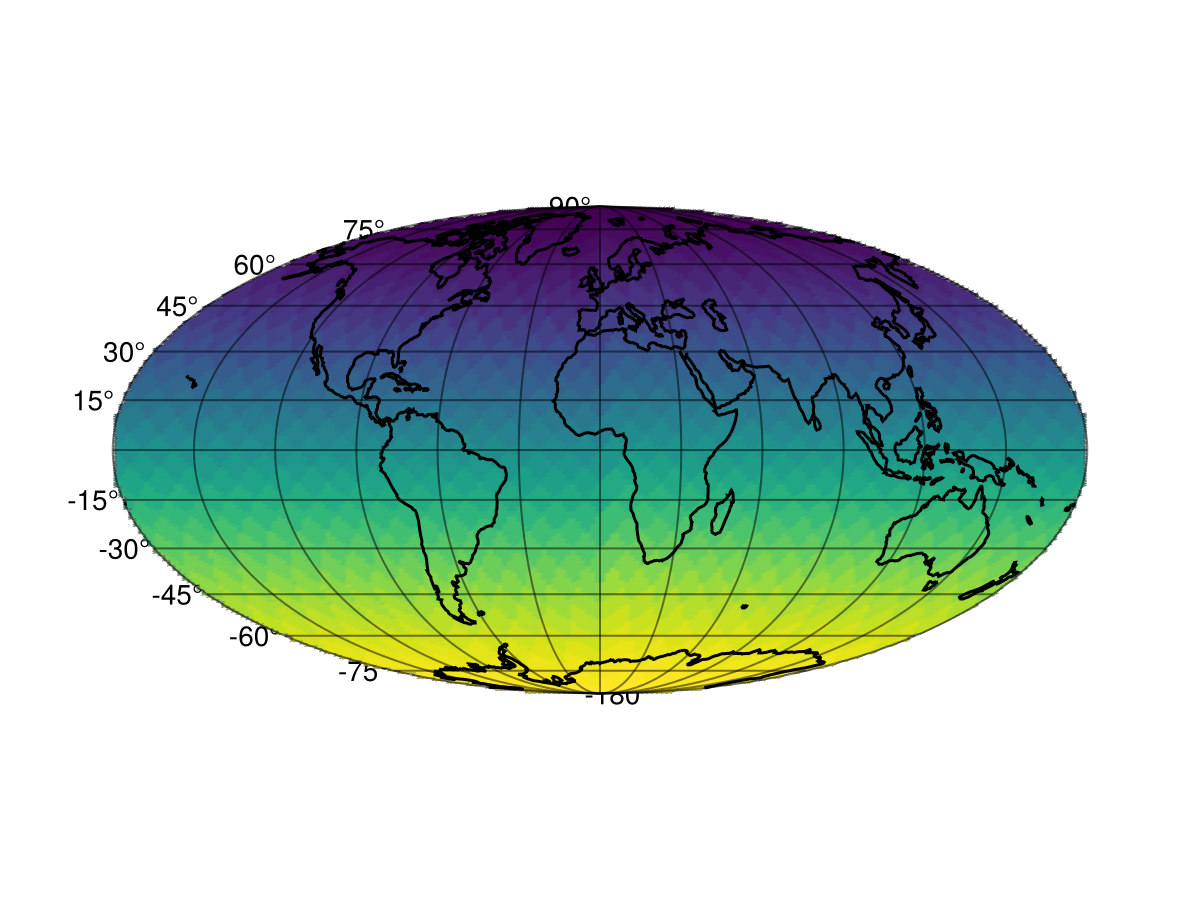
Note how the meshimage looks a bit pixelated there - that is because of the mollweide projection!
This page was generated using Literate.jl.