Annotated plot
This example is translated from this Cartopy example.
julia
using CairoMakie, GeoMakie, Makie
using Makie: GeometryBasics
using NaturalEarth
states_fc = naturalearth("admin_1_states_provinces_lines", 50)
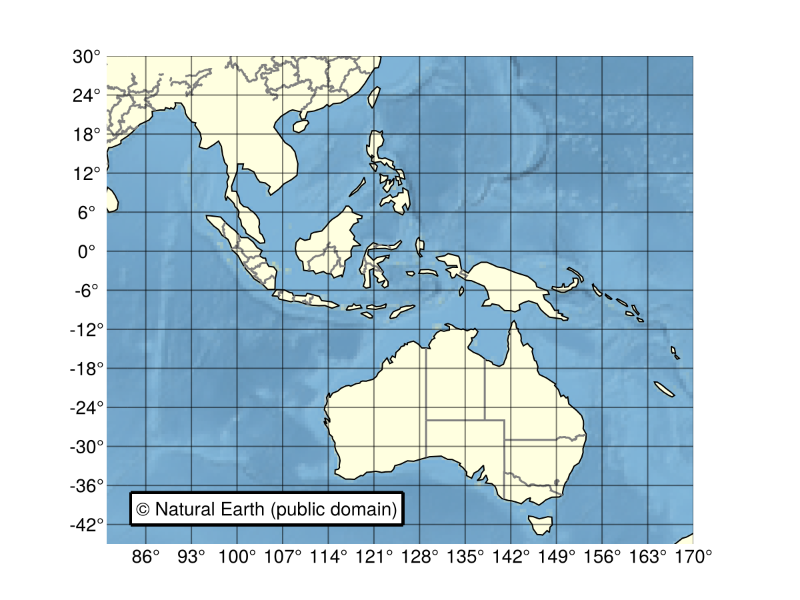
fig = Figure()
ga = GeoAxis(fig[1, 1]; limits = ((80, 170), (-45, 30)), dest = "+proj=longlat +datum=WGS84")
image!(ga, -180..180, -90..90, GeoMakie.earth() |> rotr90; interpolate = false)
poly!(ga, GeoMakie.land(); color = :lightyellow, strokecolor = :black, strokewidth = 1)
lines!(ga, GeoMakie.to_multilinestring.(states_fc.geometry); color = :gray)
fig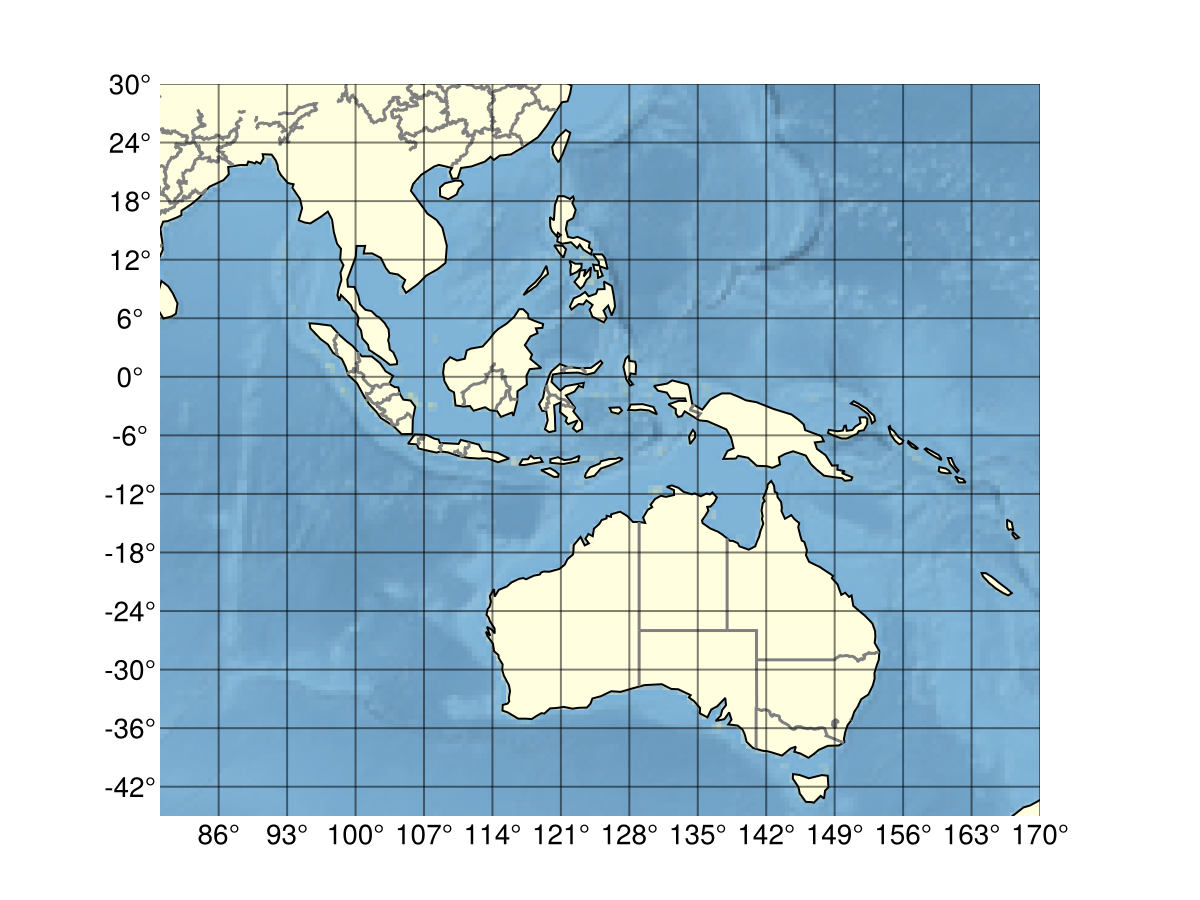
Now to add the annotation:
julia
const DATASOURCE = "Natural Earth"
const LICENSE = "public domain"
annotation_text = text!(
    ga.scene, Point2f(0.05, 0.05); # plotting in relative coordinates - (0, 0) is bottom left, (1, 1) is top right
    space = :relative, text = "© $DATASOURCE ($LICENSE)"
)
fig

_pad_rect(rect, padding::Real) = Rect(rect.origin .- padding, rect.widths .+ 2 * padding)
text_bbox = Makie.boundingbox(last(plots(ga.scene)))

annotation_box = poly!(ga.scene, _pad_rect(text_bbox, 4); space = :pixel, color = :white, strokecolor = :black, strokewidth = 2)
annotation_box.transformation.transform_func[] = identity
translate!(annotation_text, 0, 0, 110)
translate!(annotation_box, 0, 0, 109)
fig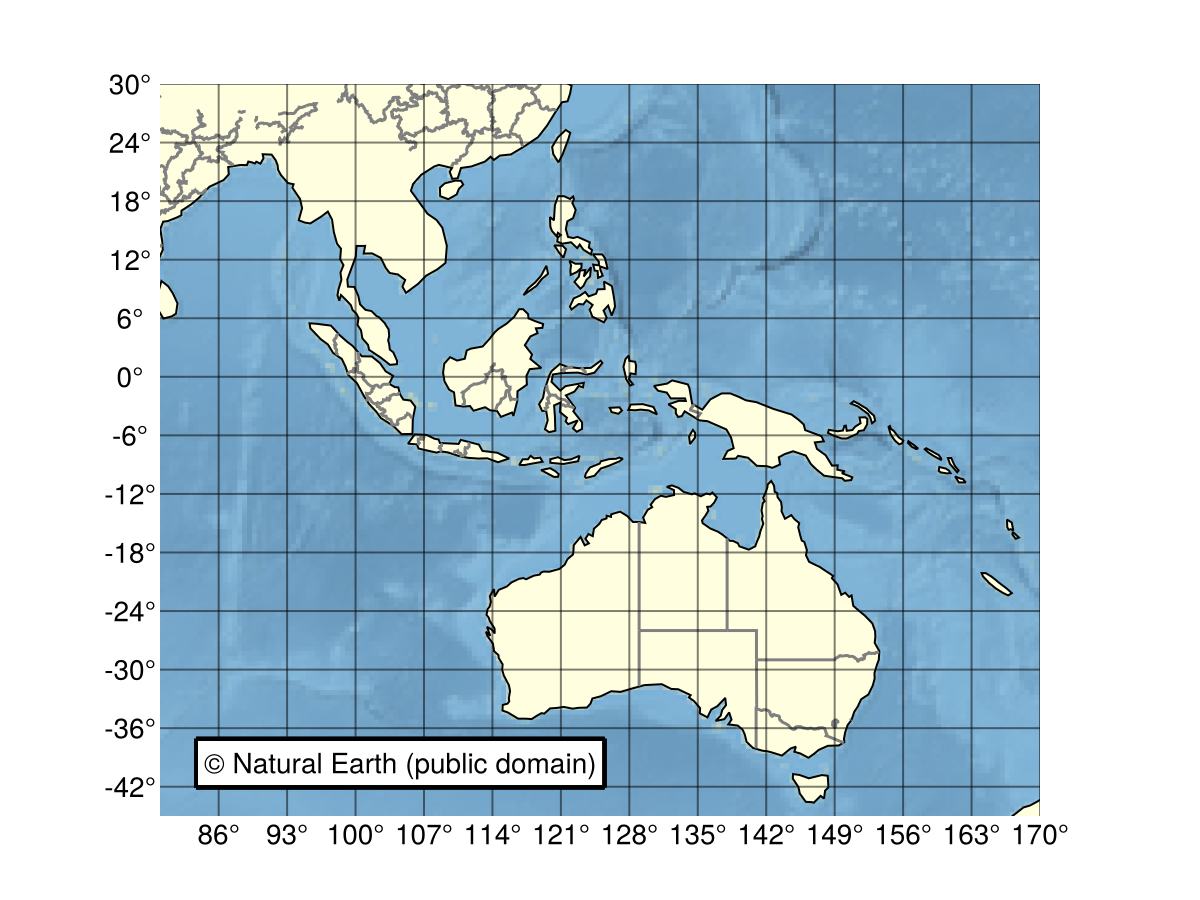
This page was generated using Literate.jl.