Histogram
You can use any Makie compatible recipe in GeoMakie, and this includes histograms! Until we get the datashader recipe working, you can also consider this a replacement for that if you use it with the correct nbins.
We use the excellent FHist.jl to create the histogram.
julia
using CairoMakie, GeoMakie
using FHist
import CairoMakie: Point2d
First, we generate random points in a normal distribution:
julia
random_data = randn(Point2d, 100_000)100000-element Vector{GeometryBasics.Point{2, Float64}}:
[0.8676581967919962, -0.16073293353470997]
[0.40647100799369335, 2.0746352155237817]
[-1.064960701870337, -0.14866597070604526]
[-0.42316696617168154, 0.39359418797805046]
[1.7944962811777827, 0.596982873258719]
[0.3521286703020424, 0.7237373706872414]
[-1.5608267046902975, 0.9615759096744884]
[-0.8285717239963908, 1.3456903442098702]
[-1.3477189331133623, -0.4577491618497142]
[0.5224864640801985, 0.1594048902557375]
⋮
[0.08544509887701279, -1.6284578407031132]
[0.9967830469042673, -0.8640929841307645]
[-0.380624635552826, 1.8341743636694383]
[-1.7789352090537442, 0.9822867448430055]
[-0.797947936607492, 1.1079249170205638]
[0.7318397018898902, -0.10821605208141044]
[0.444178642757322, 0.48164420537240327]
[-0.09480162265373868, -0.07656212330981005]
[0.46431434060975035, -2.174505858981299]then, we rescale them to be within the lat/long bounds of the Earth:
julia
xmin, xmax = extrema(first, random_data)
ymin, ymax = extrema(last, random_data)
latlong_data = random_data .* (Point2d(1/(xmax - xmin), 1/(ymax - ymin)) * Point2d(360, 180),)
100000-element Vector{GeometryBasics.Point{2, Float64}}:
[34.192707992545216, -2.9427150753384477]
[16.01822530479214, 37.98263486077348]
[-41.9680127926204, -2.7217918790241584]
[-16.67618027455606, 7.2059628668351605]
[70.71757929894802, 10.929623831434194]
[13.876700345778412, 13.250258204534292]
[-61.509119533202636, 17.60463063327555]
[-32.65238675118537, 24.63703719927826]
[-53.11096017573503, -8.380518725540497]
[20.590166914120132, 2.9184011224241857]
⋮
[3.367223782473235, -29.81397360208887]
[39.2812651119203, -15.819903208241255]
[-14.999670453579215, 33.580252858408706]
[-70.10434796297329, 17.98380673323819]
[-31.445563345740805, 20.28400330885179]
[28.840367458743973, -1.9812306093748278]
[17.504209243316943, 8.817991639483804]
[-3.7359460356666663, -1.401707226447441]
[18.297717608062165, -39.8110768709028]finally, we can create the histogram.
julia
h = Hist2D((first.(latlong_data), last.(latlong_data)); nbins = (360, 180))- edges: ([-200.0, -199.0, -198.0, -197.0, -196.0, -195.0, -194.0, -193.0, -192.0, -191.0 … 152.0, 153.0, 154.0, 155.0, 156.0, 157.0, 158.0, 159.0, 160.0, 161.0], [-96.0, -95.0, -94.0, -93.0, -92.0, -91.0, -90.0, -89.0, -88.0, -87.0 … 76.0, 77.0, 78.0, 79.0, 80.0, 81.0, 82.0, 83.0, 84.0, 85.0])
- bin counts: [0.0 0.0 … 0.0 0.0; 0.0 0.0 … 0.0 0.0; … ; 0.0 0.0 … 0.0 0.0; 0.0 0.0 … 0.0 0.0]
- maximum count: 37.0
- total count: 100000.0
This is what the histogram looks like without any projection,
julia
plot(h)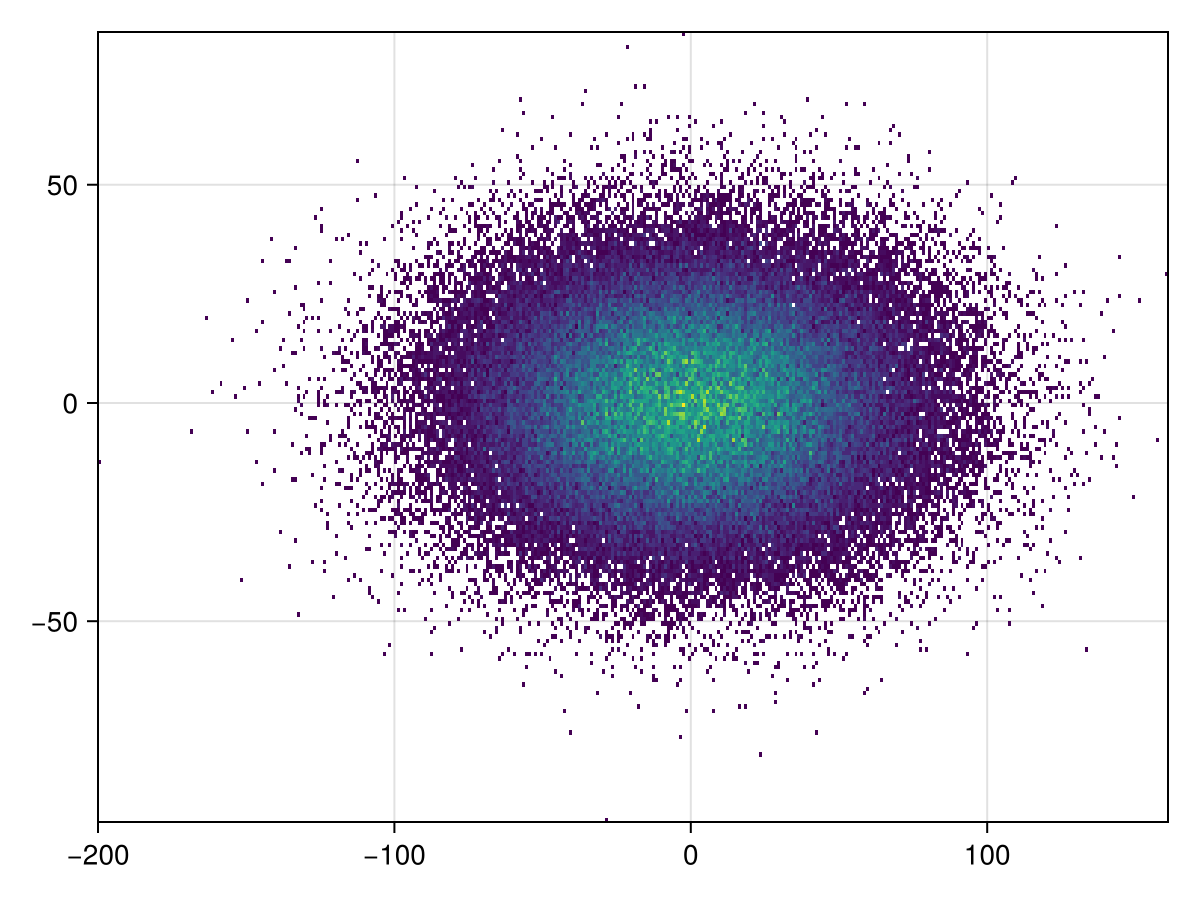
It's simple to plot to GeoAxis:
julia
plot(h; axis = (; type = GeoAxis))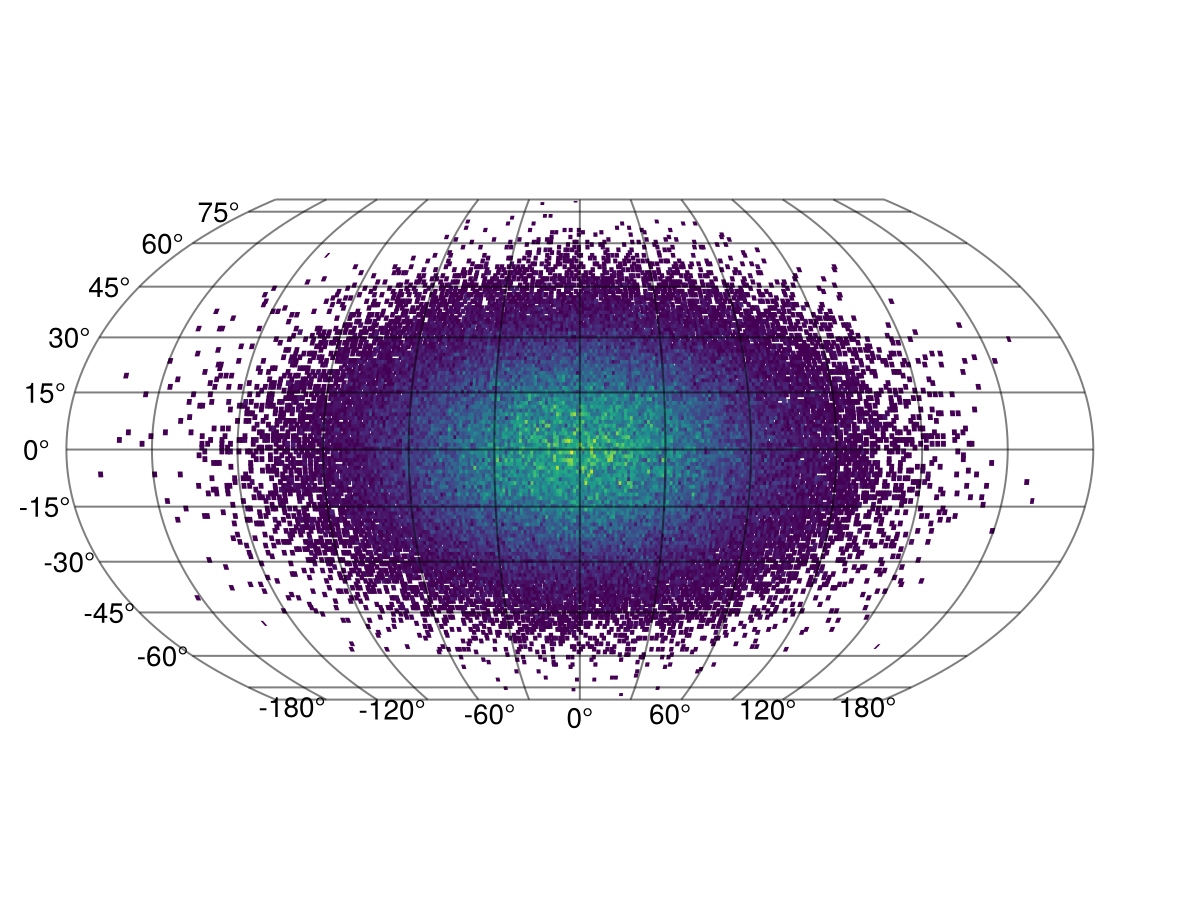
The projection can also be arbitrary!
julia
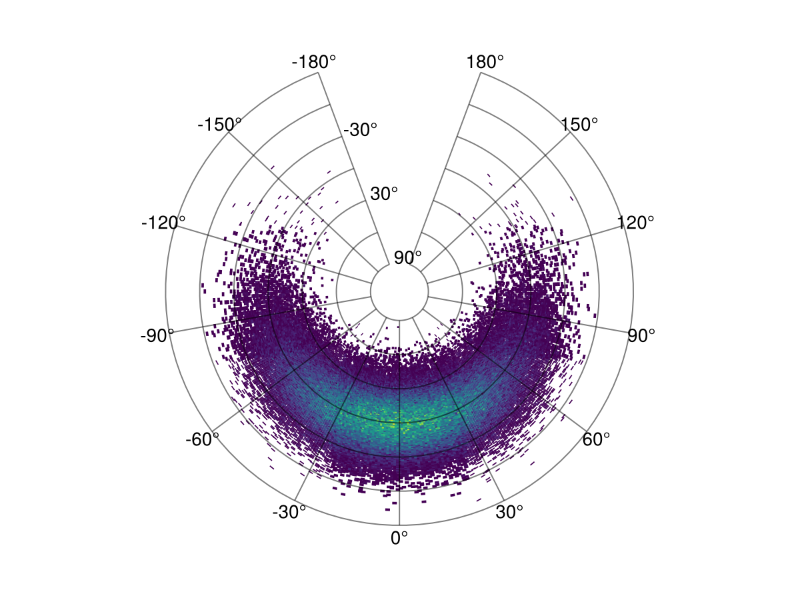
plot(h; axis = (; type = GeoAxis, dest = "+proj=tissot +lat_1=60 +lat_2=65"))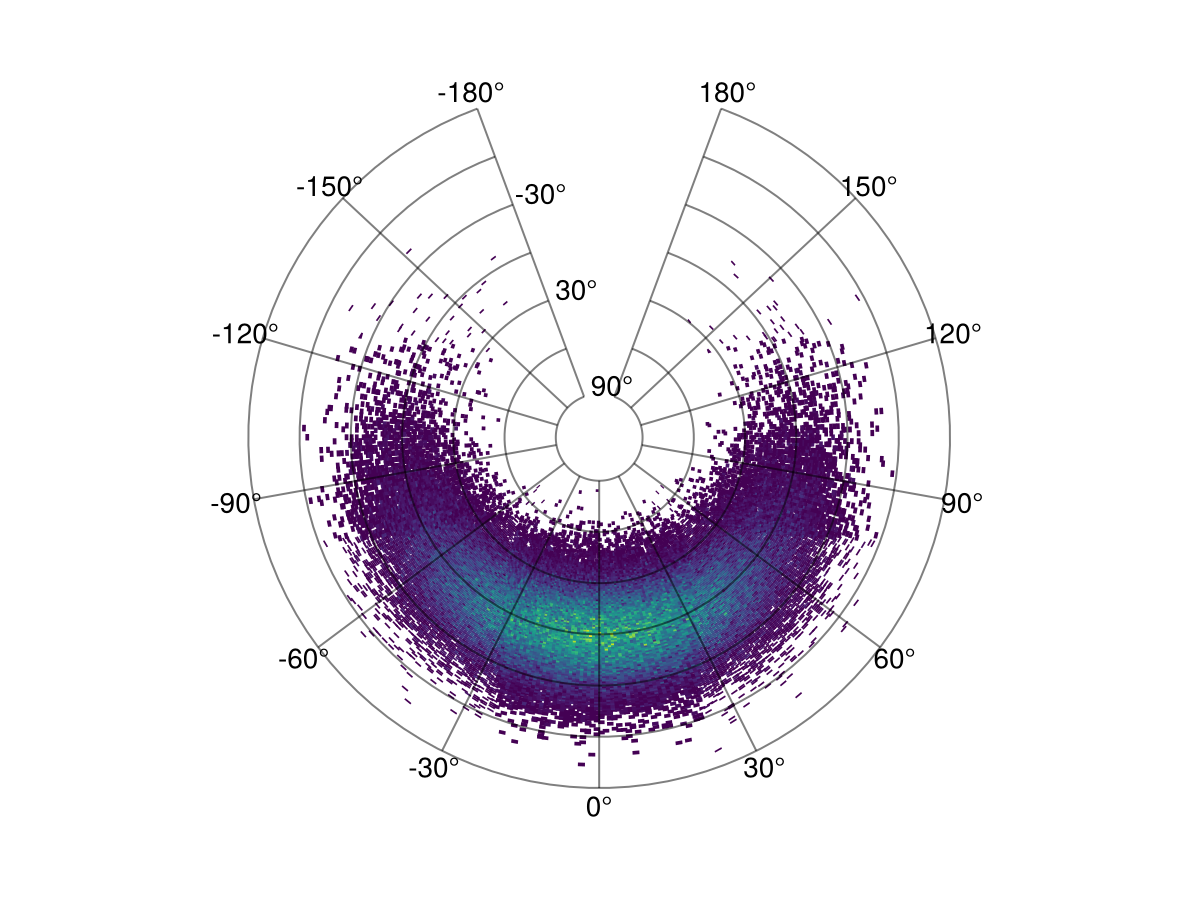
This page was generated using Literate.jl.