Hurricane Katrina
Taken from the Cartopy Hurricane Katrina example
using CairoMakie, GeoMakie
using Makie
using DataFrames
using NaturalEarth
import GeometryOps as GO
import LibGEOS # to activate buffering in GeometryOps
The below data is a list of latitudes and a list of longitudes (lons, lats) for Hurricane Katrina (2005).
The data was originally sourced from the HURDAT2 dataset from AOML/NOAA: https://www.aoml.noaa.gov/hrd/hurdat/newhurdat-all.html on 14th Dec 2012.
lons = [-75.1, -75.7, -76.2, -76.5, -76.9, -77.7, -78.4, -79.0,
        -79.6, -80.1, -80.3, -81.3, -82.0, -82.6, -83.3, -84.0,
        -84.7, -85.3, -85.9, -86.7, -87.7, -88.6, -89.2, -89.6,
        -89.6, -89.6, -89.6, -89.6, -89.1, -88.6, -88.0, -87.0,
        -85.3, -82.9]

lats = [23.1, 23.4, 23.8, 24.5, 25.4, 26.0, 26.1, 26.2, 26.2, 26.0,
        25.9, 25.4, 25.1, 24.9, 24.6, 24.4, 24.4, 24.5, 24.8, 25.2,
        25.7, 26.3, 27.2, 28.2, 29.3, 29.5, 30.2, 31.1, 32.6, 34.1,
        35.6, 37.0, 38.6, 40.1]

katrina_path = GO.LineString(Point2.(lons, lats))
33-element GeometryBasics.LineString{2, Float64, GeometryBasics.Point{2, Float64}, Base.ReinterpretArray{GeometryBasics.Line{2, Float64}, 1, Tuple{GeometryBasics.Point{2, Float64}, GeometryBasics.Point{2, Float64}}, GeometryBasics.TupleView{Tuple{GeometryBasics.Point{2, Float64}, GeometryBasics.Point{2, Float64}}, 2, 1, Vector{GeometryBasics.Point{2, Float64}}}, false}}:
Line([-75.1, 23.1] => [-75.7, 23.4])
Line([-75.7, 23.4] => [-76.2, 23.8])
Line([-76.2, 23.8] => [-76.5, 24.5])
Line([-76.5, 24.5] => [-76.9, 25.4])
Line([-76.9, 25.4] => [-77.7, 26.0])
Line([-77.7, 26.0] => [-78.4, 26.1])
Line([-78.4, 26.1] => [-79.0, 26.2])
Line([-79.0, 26.2] => [-79.6, 26.2])
Line([-79.6, 26.2] => [-80.1, 26.0])
Line([-80.1, 26.0] => [-80.3, 25.9])
⋮
Line([-89.6, 29.3] => [-89.6, 29.5])
Line([-89.6, 29.5] => [-89.6, 30.2])
Line([-89.6, 30.2] => [-89.6, 31.1])
Line([-89.6, 31.1] => [-89.1, 32.6])
Line([-89.1, 32.6] => [-88.6, 34.1])
Line([-88.6, 34.1] => [-88.0, 35.6])
Line([-88.0, 35.6] => [-87.0, 37.0])
Line([-87.0, 37.0] => [-85.3, 38.6])
Line([-85.3, 38.6] => [-82.9, 40.1])We can retrieve the US states from Natural Earth. This particular feature collection only contains US states.
states_df = DataFrame(naturalearth("admin_1_states_provinces_lakes", 110))
states_df.geometry .= GeoMakie.to_multipoly.(states_df.geometry)
states_df.color = fill(RGBAf(colorant"lightyellow"), size(states_df, 1))
We also have to filter for the continental states only, since we're focused on those:
filter!(:name_en => !in(("Alaska", "Hawaii")), states_df)In order to get a sense of which states are indirectly affected, we intersect by a buffered version of the linestring! For context, let's see what this looks like:
buffered_katrina_path = LibGEOS.buffer(katrina_path, 2) # within 2 degrees of the path
affected_states = view(states_df, GO.intersects.(states_df.geometry, (buffered_katrina_path,)), :)
affected_states.color .= Makie.wong_colors()[end]
Finally, we can intersect the states directly:
direct_states = view(states_df, GO.intersects.(states_df.geometry, (katrina_path,)), :)
direct_states.color .= Makie.wong_colors()[end-1]
Now, we can plot these.
fig = Figure()
ga = GeoAxis(
    fig[1, 1];
    dest = "+proj=lcc +lon_0=-96 +lat_0=39 +lat_1=33 +lat_2=45"
)
hidedecorations!(ga)
poly!(ga, states_df.geometry; color = states_df.color, strokecolor = :black, strokewidth = 1.3)
fig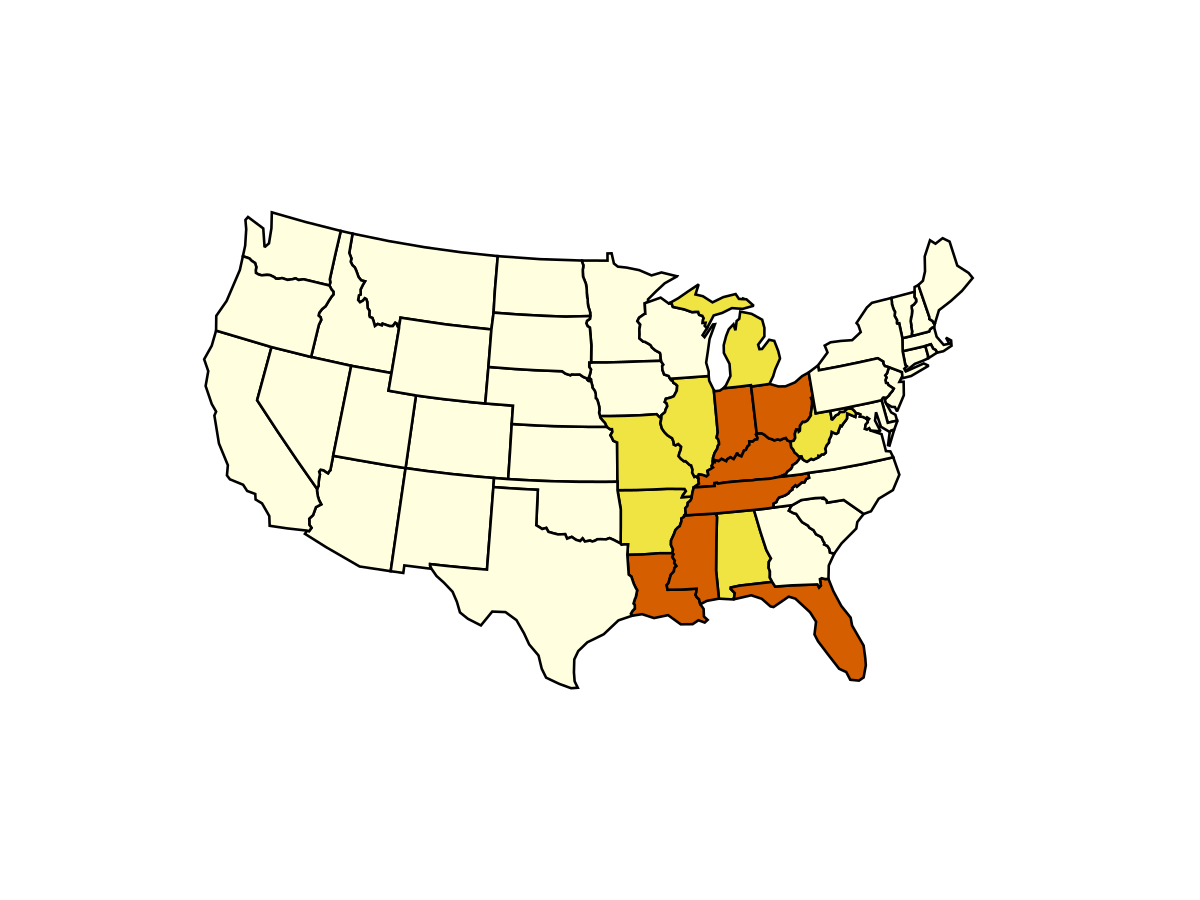
We can also add the path for clarity:
lines!(ga, katrina_path; color = Makie.wong_colors()[1])
poly!(ga, buffered_katrina_path; color = Makie.wong_colors(0.2)[1])

fig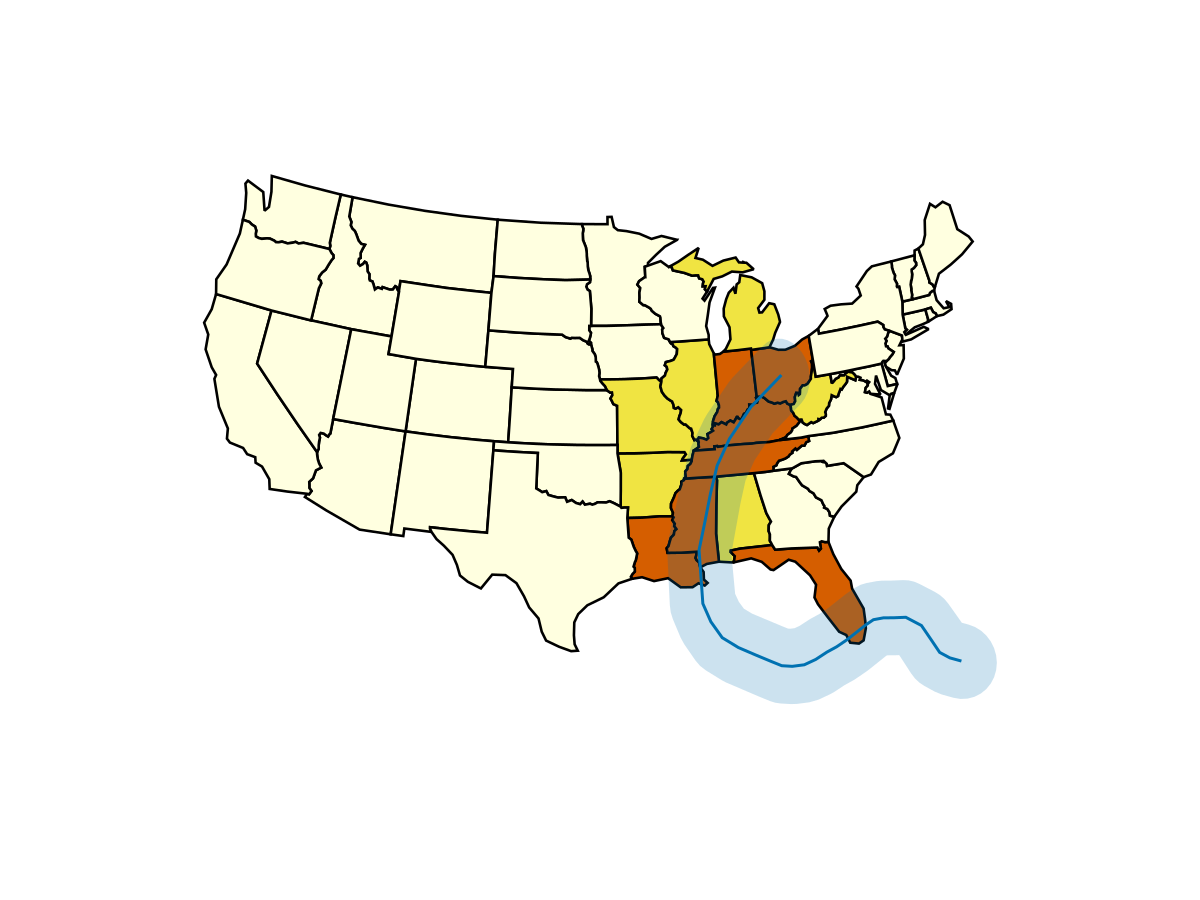
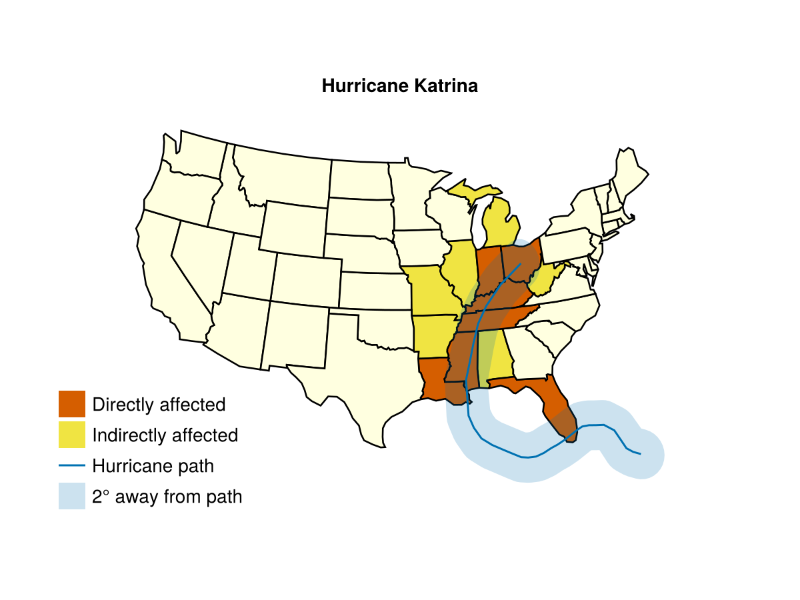
Finally, we add a legend to the figure.
leg = axislegend(
    ga,
    [PolyElement(color = first(direct_states.color)), PolyElement(color = first(affected_states.color)), LineElement(color = Makie.wong_colors()[1]), PolyElement(color = Makie.wong_colors(0.2)[1])],
    ["Directly affected", "Indirectly affected", "Hurricane path", "2° away from path"],
    position = :lb,
    framevisible = false
)
ga.title = "Hurricane Katrina"
fig
This page was generated using Literate.jl.