Pure Julia code
Fast, understandable, extensible functions
GeoMakie.jl is a Julia package for plotting geospatial data on a given map projection. It is built on top of the Makie.jl plotting ecosystem.
GeoMakie provides a GeoAxis type which handles CRS and projections, and various utilities and integrations to handle plotting geometries. GeoAxis should work seamlessly with any Makie plotting function, and can be used as a drop-in replacement for Makie.Axis.
The main entry point to GeoMakie is the function GeoAxis(fig[i, j]; kw_args...). It creates an axis which accepts nonlinear projections, but is otherwise identical in usage to Makie's Axis. Projections are accepted as PROJ-strings, and can be set through the source="+proj=latlong +datum=WGS84" and dest="+proj=eqearth" keyword arguments to GeoAxis.
using CairoMakie, GeoMakie

fig = Figure()
ga = GeoAxis(
    fig[1, 1]; # any cell of the figure's layout
    dest = "+proj=wintri", # the CRS in which you want to plot
)
lines!(ga, GeoMakie.coastlines()) # plot coastlines from Natural Earth as a reference
# You can plot your data the same way you would in Makie
scatter!(ga, -120:15:120, -60:7.5:60; color = -60:7.5:60, strokecolor = (:black, 0.2))
fig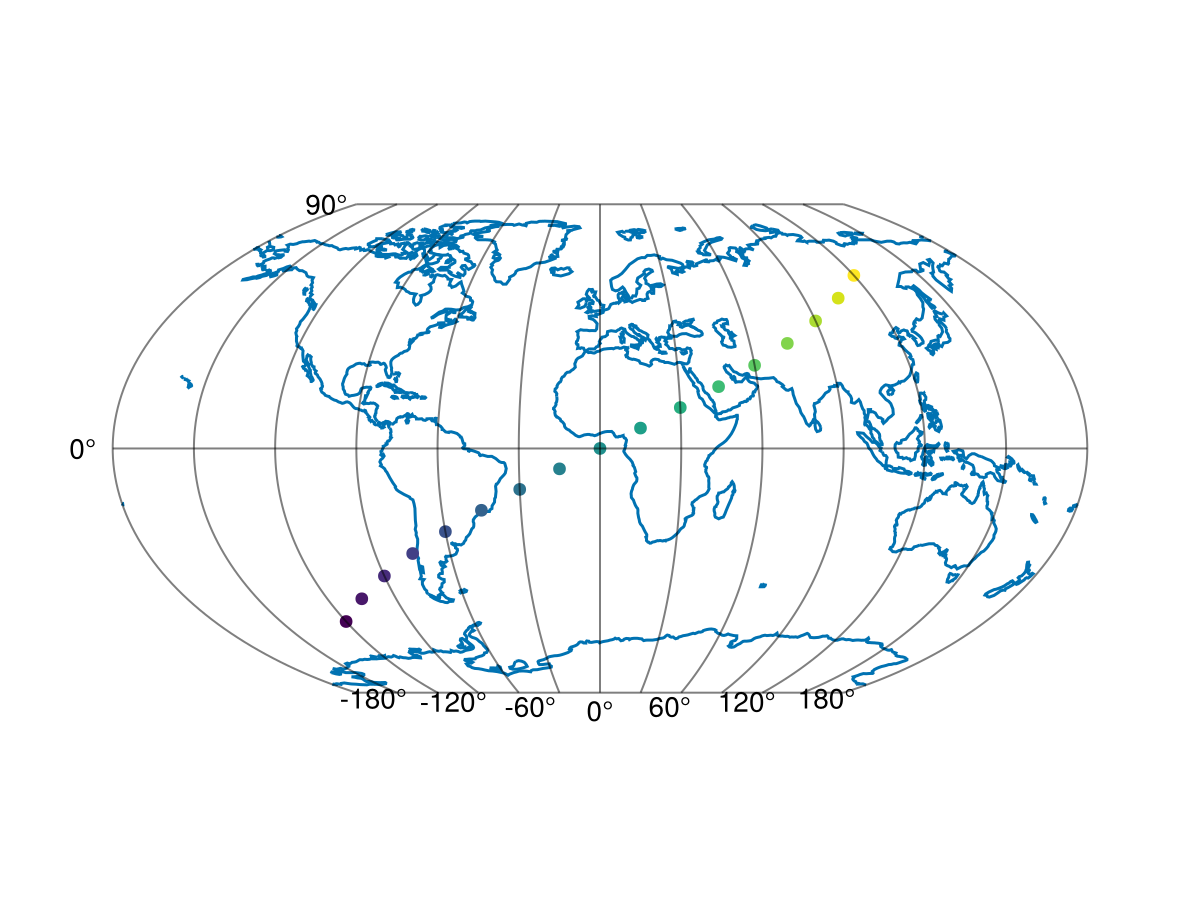
As you can see, the axis automatically transforms your input from the source CRS (default "+proj=longlat +datum=WGS84") to the dest CRS.
You can also use quite a few other plot types and projections:
fieldlons = -180:180; fieldlats = -90:90
field = [exp(cosd(lon)) + 3(lat/90) for lon in fieldlons, lat in fieldlats]

img = rotr90(GeoMakie.earth())
land = GeoMakie.land()

fig = Figure(size = (1000, 1000))

ga1 = GeoAxis(fig[1, 1]; dest = "+proj=ortho", title = "Orthographic\n "); lines!(ga1, GeoMakie.coastlines())
ga2 = GeoAxis(fig[1, 2]; dest = "+proj=moll", title = "Image of Earth\n ")
ga3 = GeoAxis(fig[2, 1]; title = "Plotting polygons")
ga4 = GeoAxis(fig[2, 2]; dest = "+proj=natearth", title = "Auto limits") # you can plot geodata on regular axes too

surface!(ga1, fieldlons, fieldlats, field; colormap = :rainbow_bgyrm_35_85_c69_n256, shading = NoShading)
image!(ga2, -180..180, -90..90, img; interpolate = false) # this must be included
poly!(ga3, land[50:100]; color = 1:51, colormap = (:plasma, 0.5))
poly!(ga4, land[22]);

ylims!(ga3, (-90, 90)) # you can manipulate the axes as usual for Makie!

fig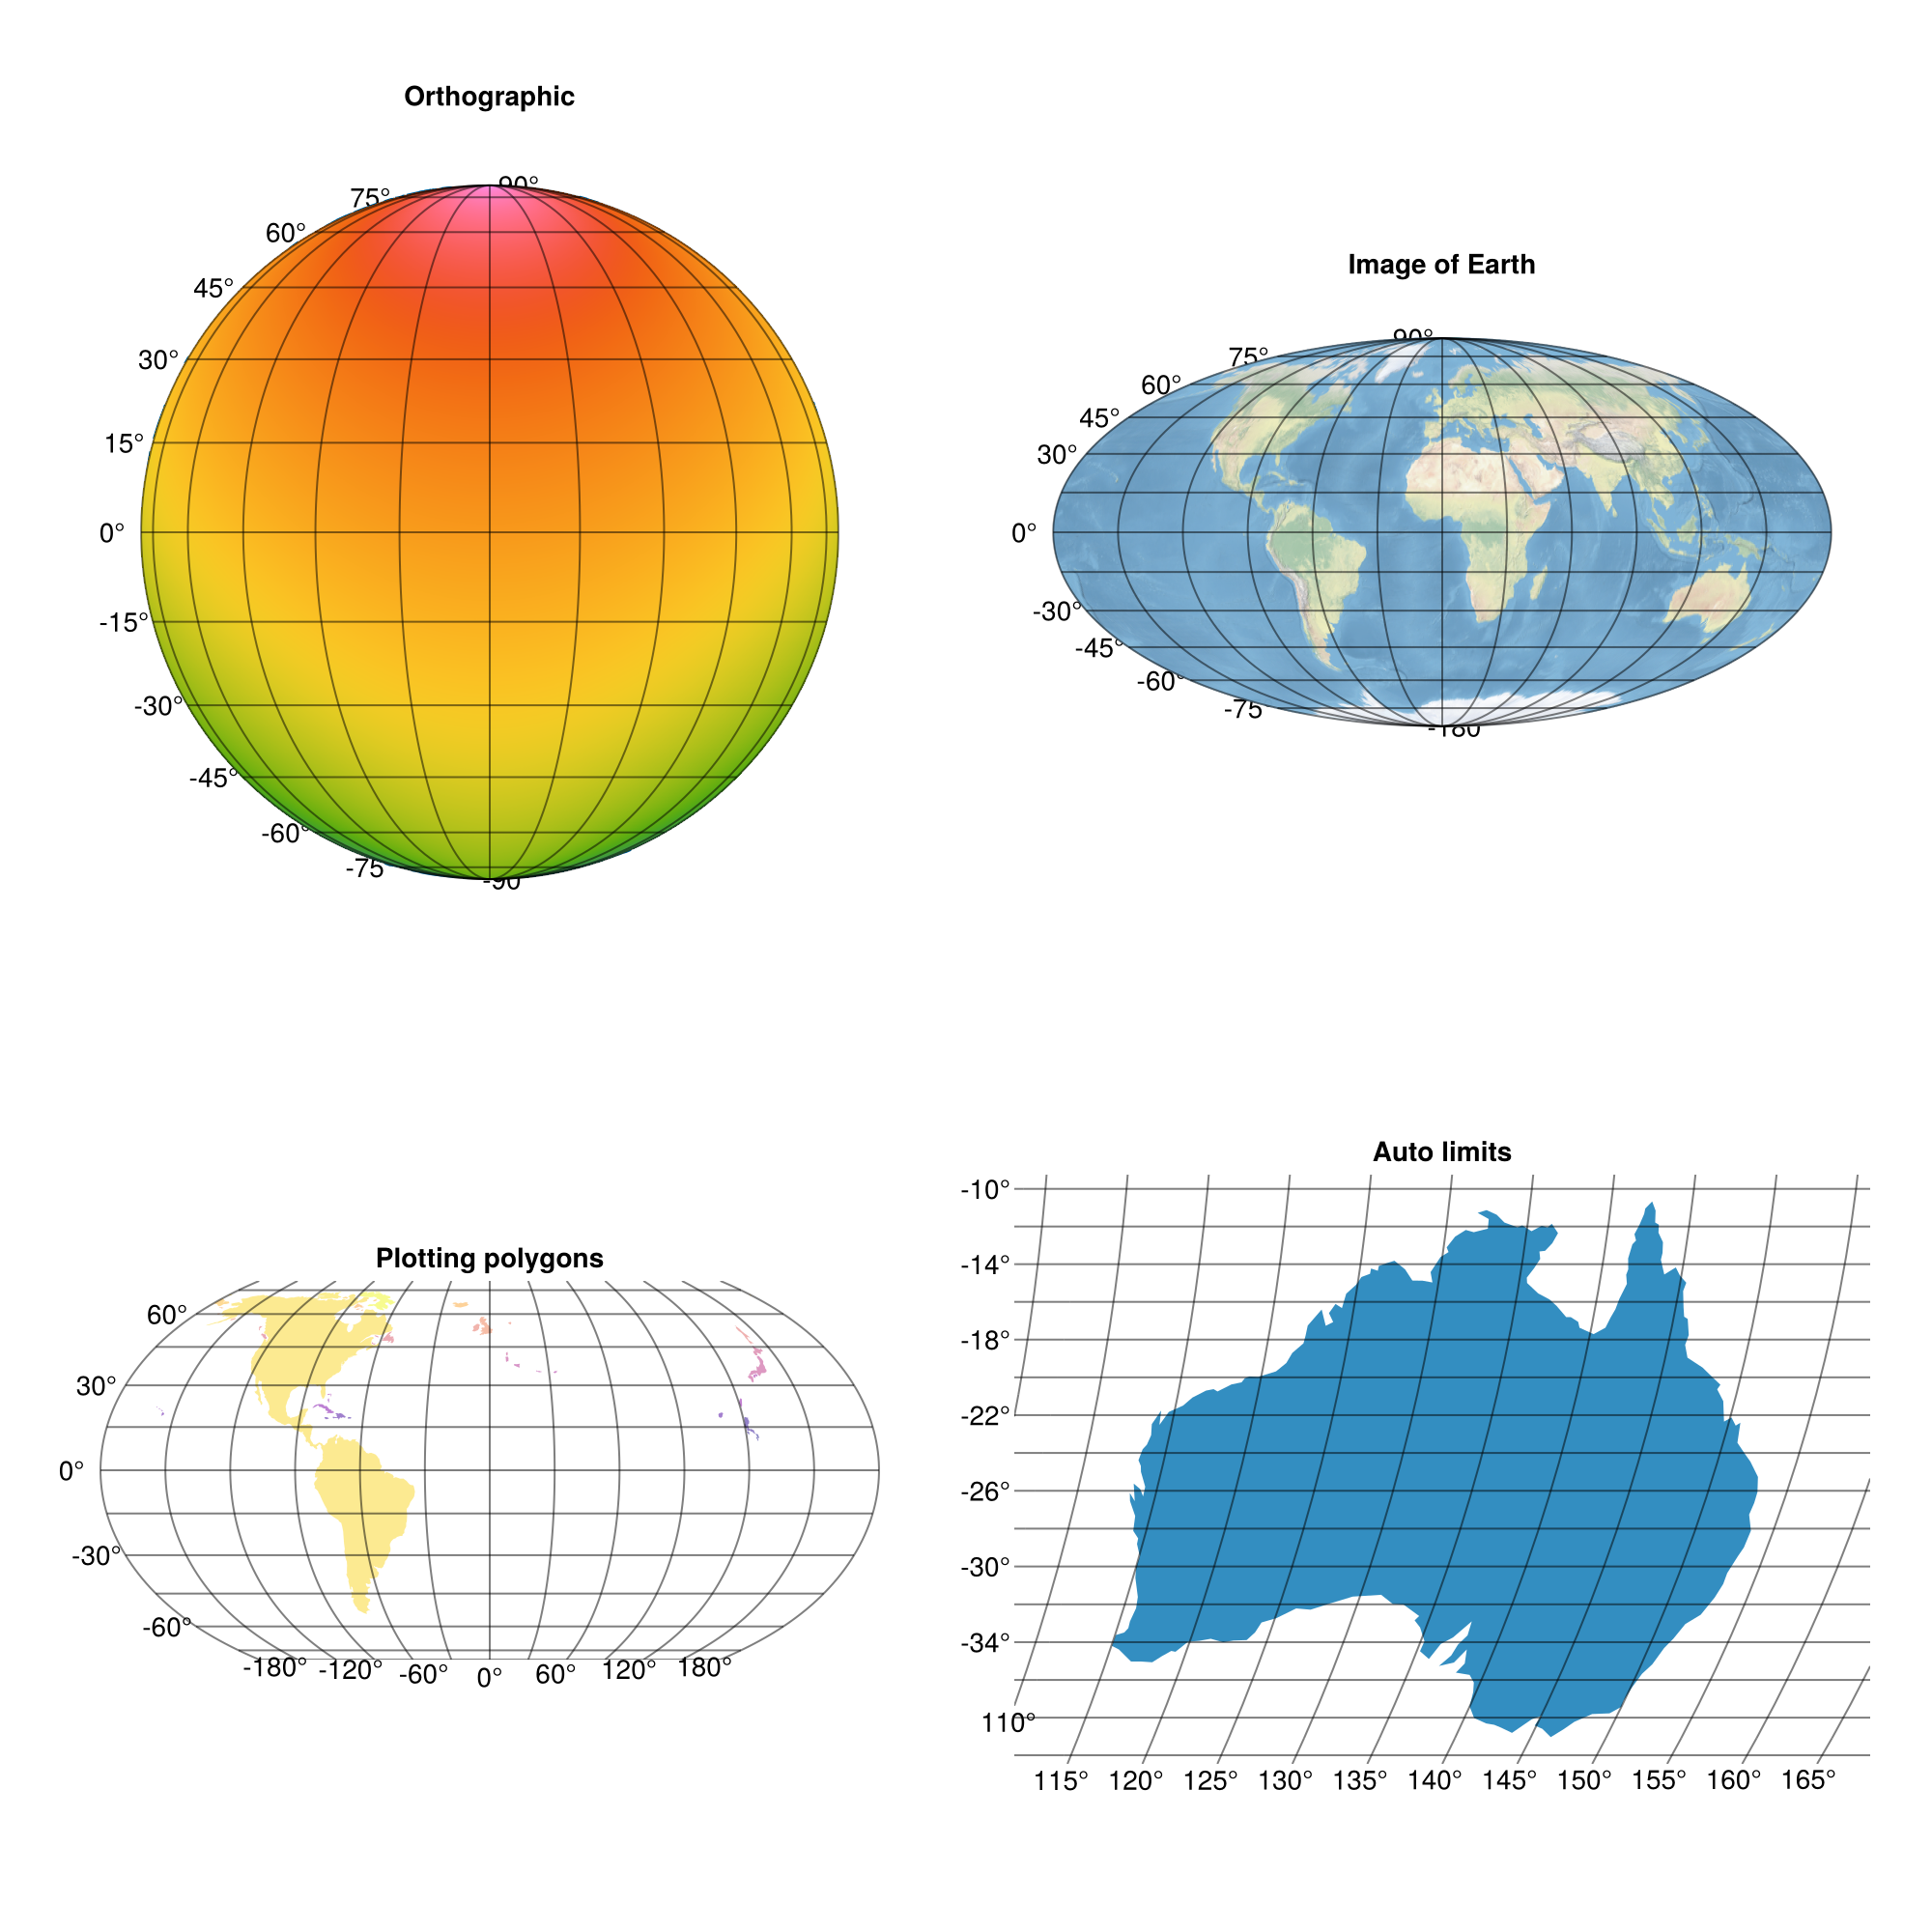
See the documentation for examples and basic usage!
