New API

Example of the new API
julia
using Makie, GeoMakie # add your preferred backend hereGeoAxis is a Block object, just like Axis or Axis3, with the same semantics.
You can insert it into a figure in the same way, or specify it when plotting as plot(...; axis = (; type = GeoAxis, geoaxis_kwargs...)).
julia
fig = Figure()
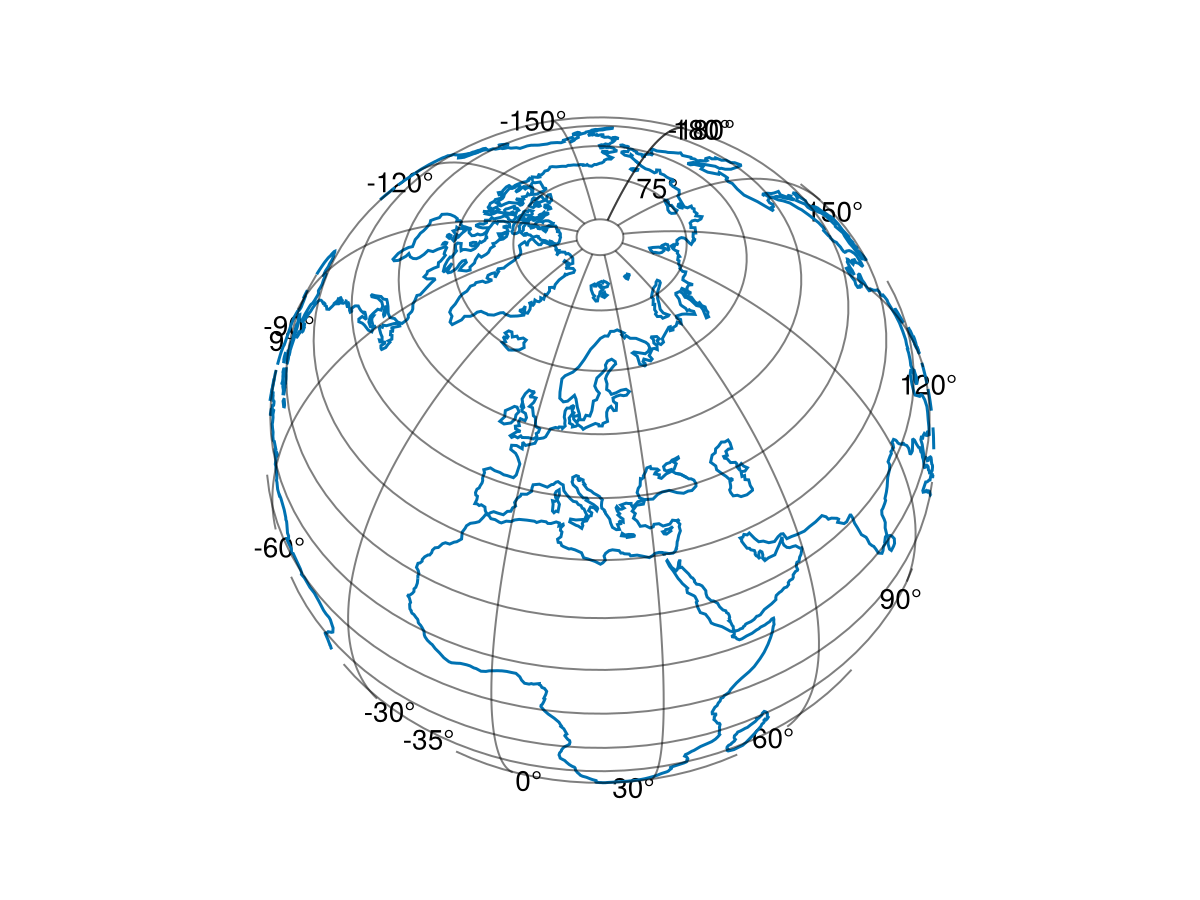
ga = GeoAxis(fig[1, 1]; dest = "+proj=ortho +lon_0=19 +lat_0=50")
lines!(ga, GeoMakie.coastlines())
fig
This is an orthographic projection, note how it shows the pole as well!
julia
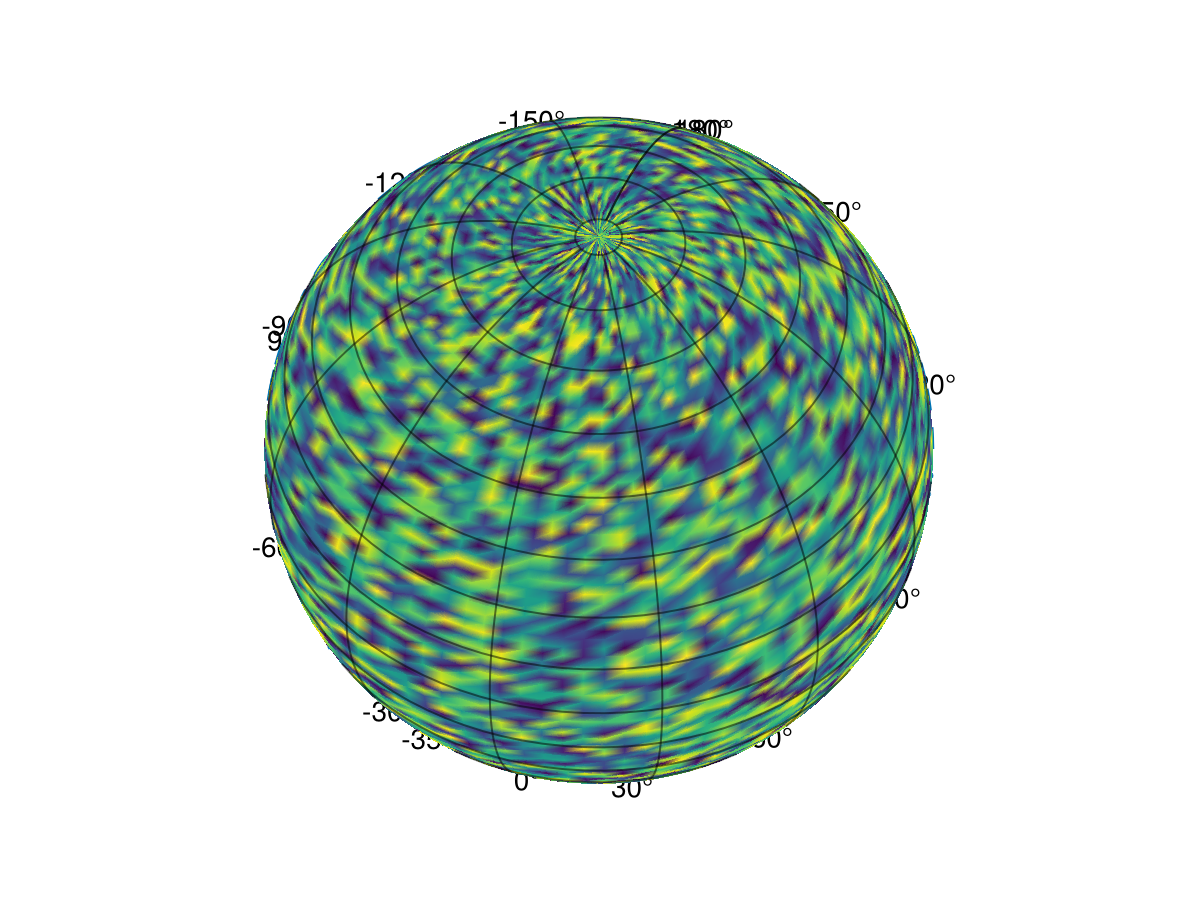
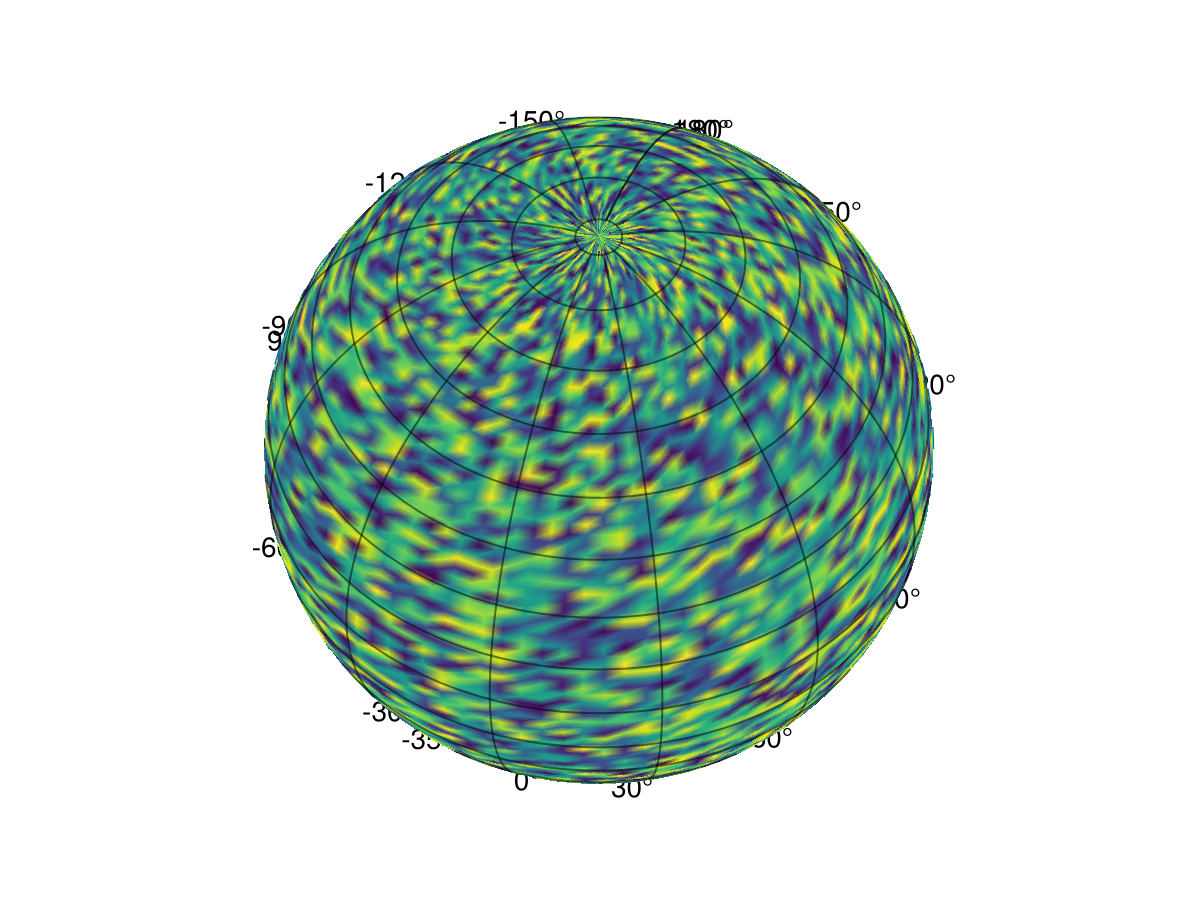
surface!(ga, -180..180, -90..90, rand(100, 100); shading = NoShading)
fig
You can plot any Makie plot type into the GeoAxis - there is no difference between it and any other axis-like object in Makie. Beware that some plot types will create points which cannot support transformations, though!
If you encounter this kind of issue, please file a GitHub issue at the GeoMakie.jl repo!
This page was generated using Literate.jl.