Histogram

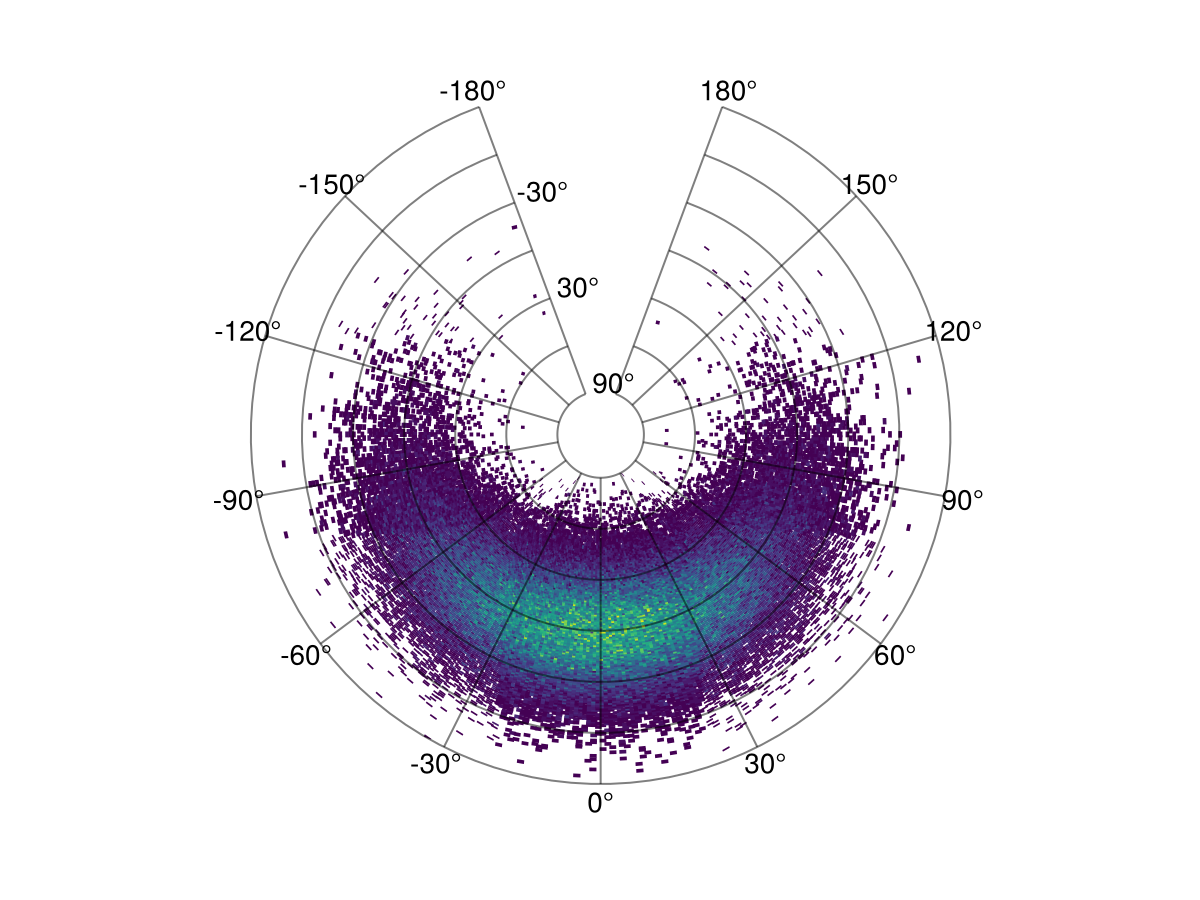
You can use any Makie compatible recipe in GeoMakie, and this includes histograms! Until we get the datashader recipe working, you can also consider this a replacement for that if you use it with the correct nbins.
We use the excellent FHist.jl to create the histogram.
julia
using CairoMakie, GeoMakie
using FHist
import CairoMakie: Point2d
First, we generate random points in a normal distribution:
julia
random_data = randn(Point2d, 100_000)100000-element Vector{GeometryBasics.Point{2, Float64}}:
[-0.7279052896182817, 0.740664095033151]
[0.8596905999564999, -0.6308007709347083]
[-2.1280803588506134, 0.28453606309768026]
[-0.5250916966211842, -1.297908434452753]
[1.3267855094704868, 1.3008386257879534]
[0.3963283407388309, 0.8406364615252221]
[-1.304259446962057, -1.8268934797697385]
[0.00702198129661575, 0.610790191743964]
[-0.3790859955337592, 0.6281080587775536]
[-0.3065463505497793, 0.022544896287304543]
⋮
[1.7700955393341882, -0.6376639918986681]
[0.46074055245271517, 2.2966579532909983]
[0.10898309097388303, -0.1633491326537027]
[-1.0568643525956956, 0.47138307895383086]
[-0.7598313746591505, 1.6665675806549327]
[-0.03380933767172223, -0.4298599806587752]
[0.6130723338240636, -0.7300250116231102]
[-0.4542467078184083, -0.5181431619291053]
[0.7897733400456632, -0.6281351267885661]then, we rescale them to be within the lat/long bounds of the Earth:
julia
xmin, xmax = extrema(first, random_data)
ymin, ymax = extrema(last, random_data)
latlong_data = random_data .* (Point2d(1/(xmax - xmin), 1/(ymax - ymin)) * Point2d(360, 180),)
100000-element Vector{GeometryBasics.Point{2, Float64}}:
[-29.023440207489347, 16.127783183225176]
[34.27805661072017, -13.73553562764632]
[-84.85199095643722, 6.195704590273775]
[-20.936745037704032, -28.261645141035654]
[52.90232184254871, 28.32544935519479]
[15.802621665243116, 18.304657507105937]
[-52.00415028417684, -39.780167741566245]
[0.27998430181392264, 13.29981006092415]
[-15.115125390338013, 13.676902465681742]
[-12.222784753592393, 0.49090971419867696]
⋮
[70.57822326631315, -13.884980619495632]
[18.37090081085892, 50.00917658233326]
[4.345433766756384, -3.556888220008681]
[-42.139876962665944, 10.264253586193115]
[-30.296414636248883, 36.28910970740639]
[-1.34806451383892, -9.360098071042307]
[24.444757411969995, -15.896119691426364]
[-18.11197466462997, -11.282443187811499]
[31.49027715447002, -13.677491865135202]finally, we can create the histogram.
julia
h = Hist2D((first.(latlong_data), last.(latlong_data)); nbins = (360, 180))- edges: ([-175.0, -174.0, -173.0, -172.0, -171.0, -170.0, -169.0, -168.0, -167.0, -166.0 … 177.0, 178.0, 179.0, 180.0, 181.0, 182.0, 183.0, 184.0, 185.0, 186.0], [-90.0, -89.0, -88.0, -87.0, -86.0, -85.0, -84.0, -83.0, -82.0, -81.0 … 82.0, 83.0, 84.0, 85.0, 86.0, 87.0, 88.0, 89.0, 90.0, 91.0])
- bin counts: [0.0 0.0 … 0.0 0.0; 0.0 0.0 … 0.0 0.0; … ; 0.0 0.0 … 0.0 0.0; 0.0 0.0 … 0.0 0.0]
- maximum count: 29.0
- total count: 100000.0
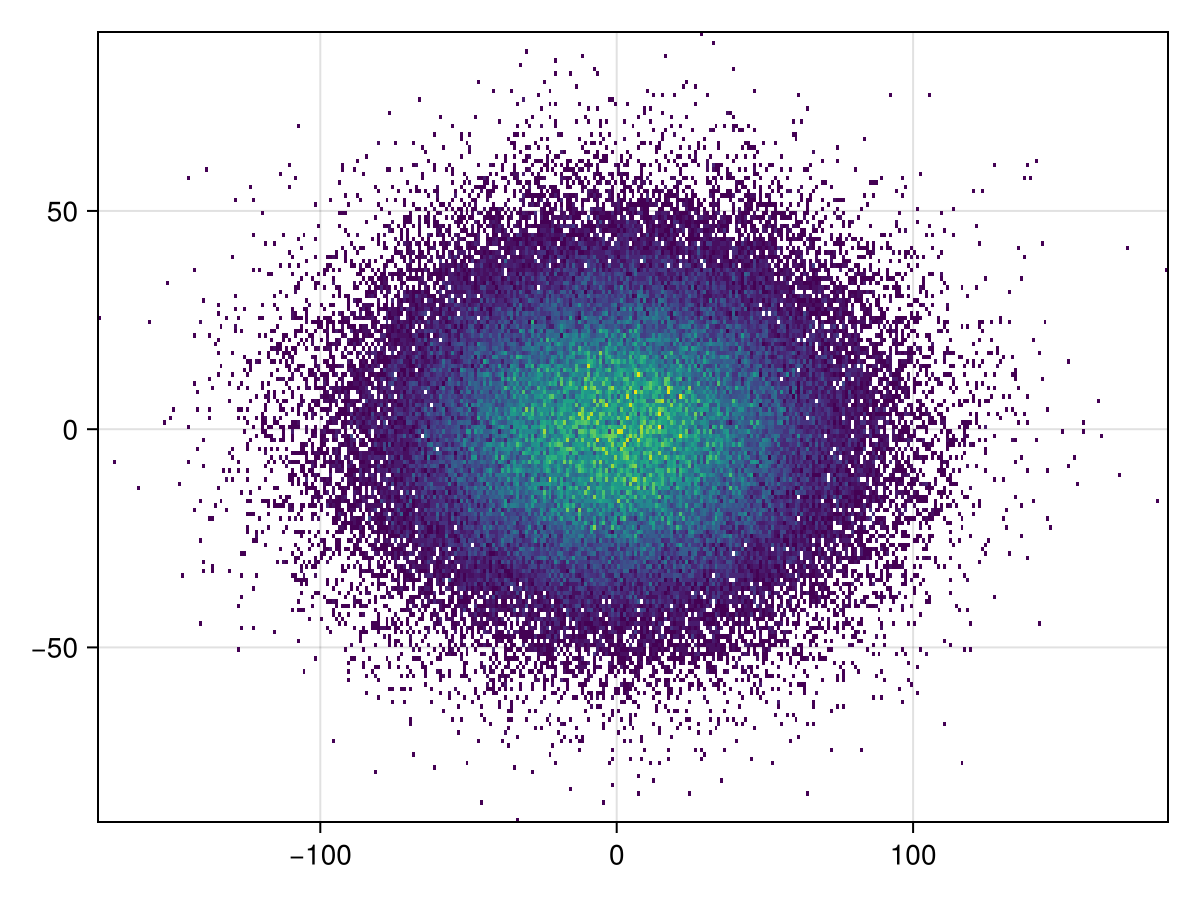
This is what the histogram looks like without any projection,
julia
plot(h)
It's simple to plot to GeoAxis:
julia
plot(h; axis = (; type = GeoAxis))
The projection can also be arbitrary!
julia
plot(h; axis = (; type = GeoAxis, dest = "+proj=tissot +lat_1=60 +lat_2=65"))
This page was generated using Literate.jl.