Histogram

You can use any Makie compatible recipe in GeoMakie, and this includes histograms! Until we get the datashader recipe working, you can also consider this a replacement for that if you use it with the correct nbins.
We use the excellent FHist.jl to create the histogram.
julia
using CairoMakie, GeoMakie
using FHist
import CairoMakie: Point2d
First, we generate random points in a normal distribution:
julia
random_data = randn(Point2d, 100_000)100000-element Vector{GeometryBasics.Point{2, Float64}}:
[1.4800807082774528, -0.000767623846921625]
[-0.211217347565993, -0.43372154677106817]
[1.0419512593039708, 0.8321949695689512]
[0.30471185610032636, 0.4793383522862792]
[-1.4884221553076726, 0.3189499894979787]
[1.531269653018025, 0.09036378654815815]
[0.01727444960118285, -0.15378158707531805]
[0.964896645938497, 0.2916304948343384]
[0.3475942981836601, -0.953578651778281]
[0.5124876979530467, -0.09845206366981403]
⋮
[-0.9946854959823764, -1.1344102327603516]
[-1.49470712807994, 0.19264071155819243]
[0.9738734831437258, 0.3868131698098779]
[0.1429596575835496, 0.25145465201154765]
[0.5313031552966647, 0.21005158582233613]
[0.03056266030822501, 1.4675695906931097]
[0.24329297858168009, 0.5413352427631158]
[-0.9845128693662827, 0.6569537427062112]
[-0.3398912910719259, -1.0443613293849021]then, we rescale them to be within the lat/long bounds of the Earth:
julia
xmin, xmax = extrema(first, random_data)
ymin, ymax = extrema(last, random_data)
latlong_data = random_data .* (Point2d(1/(xmax - xmin), 1/(ymax - ymin)) * Point2d(360, 180),)
100000-element Vector{GeometryBasics.Point{2, Float64}}:
[61.05895791682956, -0.015882945714280148]
[-8.713518840027161, -8.974155519144317]
[42.98445195415828, 17.218990236386194]
[12.570522873743942, 9.91801526055611]
[-61.40307432908685, 6.599411142686722]
[63.17069655732511, 1.8697218983450026]
[0.7126367402373398, -3.1819029713162412]
[39.805656116561245, 6.034142030185494]
[14.339586690260036, -19.73054644045897]
[21.142066515160614, -2.03707686909076]
⋮
[-41.03455946693112, -23.472142269827373]
[-61.66235335749667, 3.9859391762114815]
[40.1759847899065, 8.003571804467661]
[5.897629546403091, 5.202861536309711]
[21.918275685177385, 4.346188498694797]
[1.26082596655023, 30.365560208145663]
[10.03676060204022, 11.200796208342776]
[-40.61489993283816, 13.593064720488387]
[-14.021808352607216, -21.608935635903254]finally, we can create the histogram.
julia
h = Hist2D((first.(latlong_data), last.(latlong_data)); nbins = (360, 180))- edges: ([-175.0, -174.0, -173.0, -172.0, -171.0, -170.0, -169.0, -168.0, -167.0, -166.0 … 177.0, 178.0, 179.0, 180.0, 181.0, 182.0, 183.0, 184.0, 185.0, 186.0], [-87.0, -86.0, -85.0, -84.0, -83.0, -82.0, -81.0, -80.0, -79.0, -78.0 … 85.0, 86.0, 87.0, 88.0, 89.0, 90.0, 91.0, 92.0, 93.0, 94.0])
- bin counts: [0.0 0.0 … 0.0 0.0; 0.0 0.0 … 0.0 0.0; … ; 0.0 0.0 … 0.0 0.0; 0.0 0.0 … 0.0 0.0]
- maximum count: 33.0
- total count: 100000.0
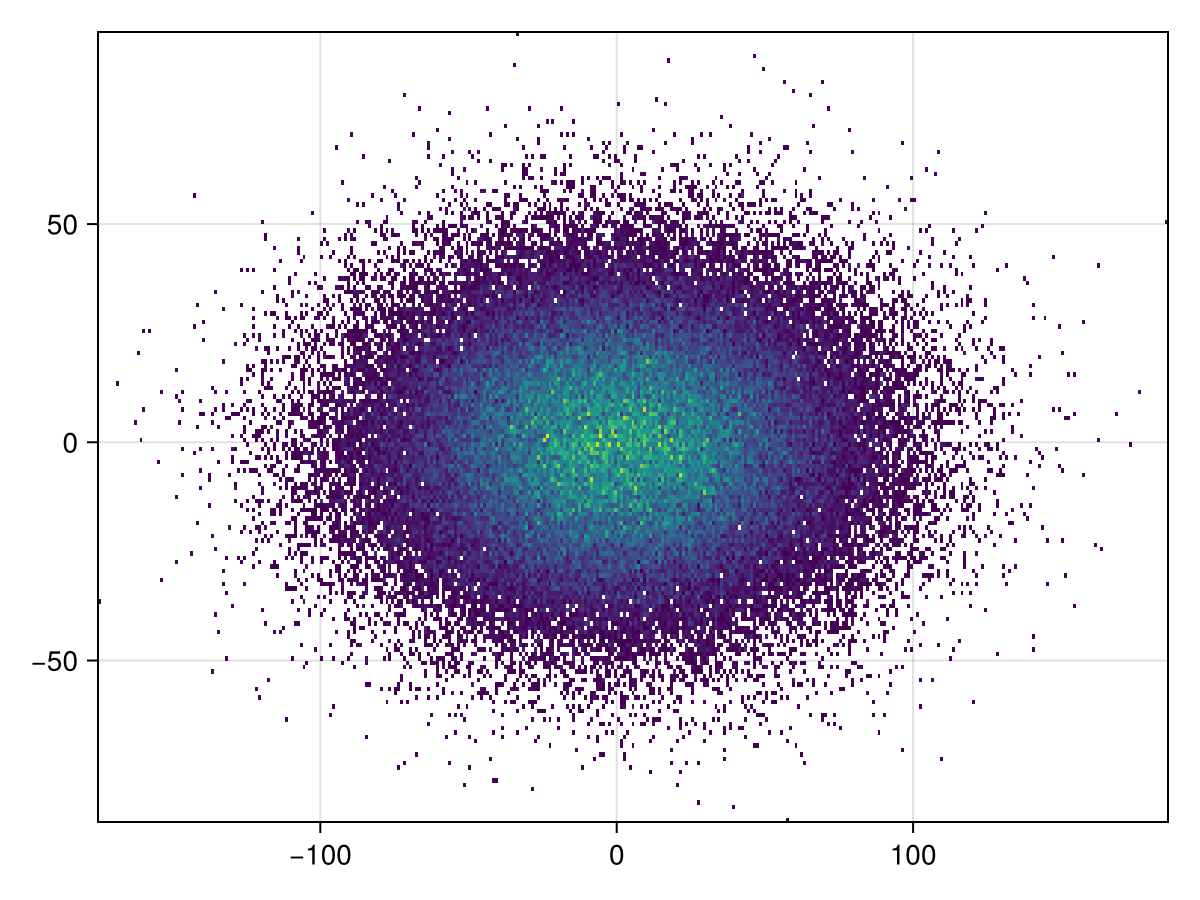
This is what the histogram looks like without any projection,
julia
plot(h)
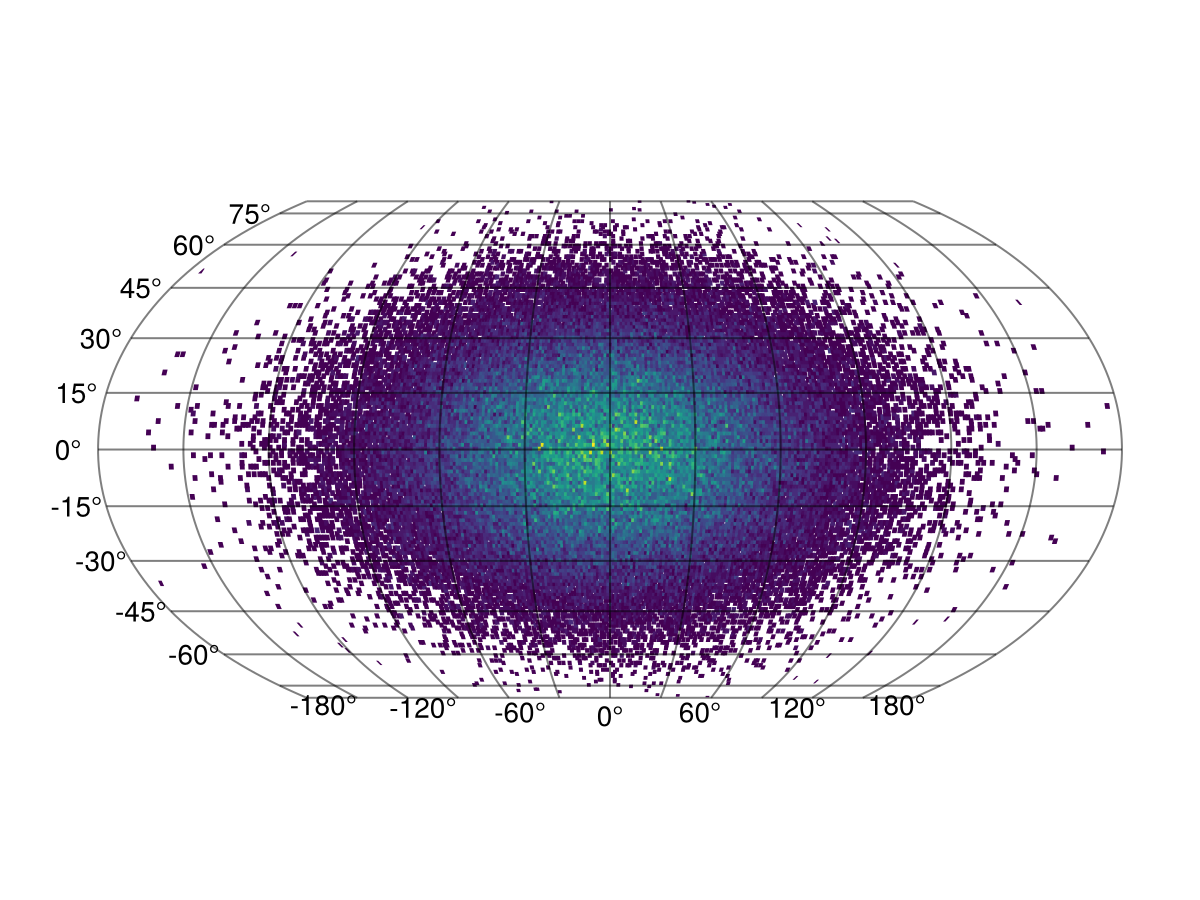
It's simple to plot to GeoAxis:
julia
plot(h; axis = (; type = GeoAxis))
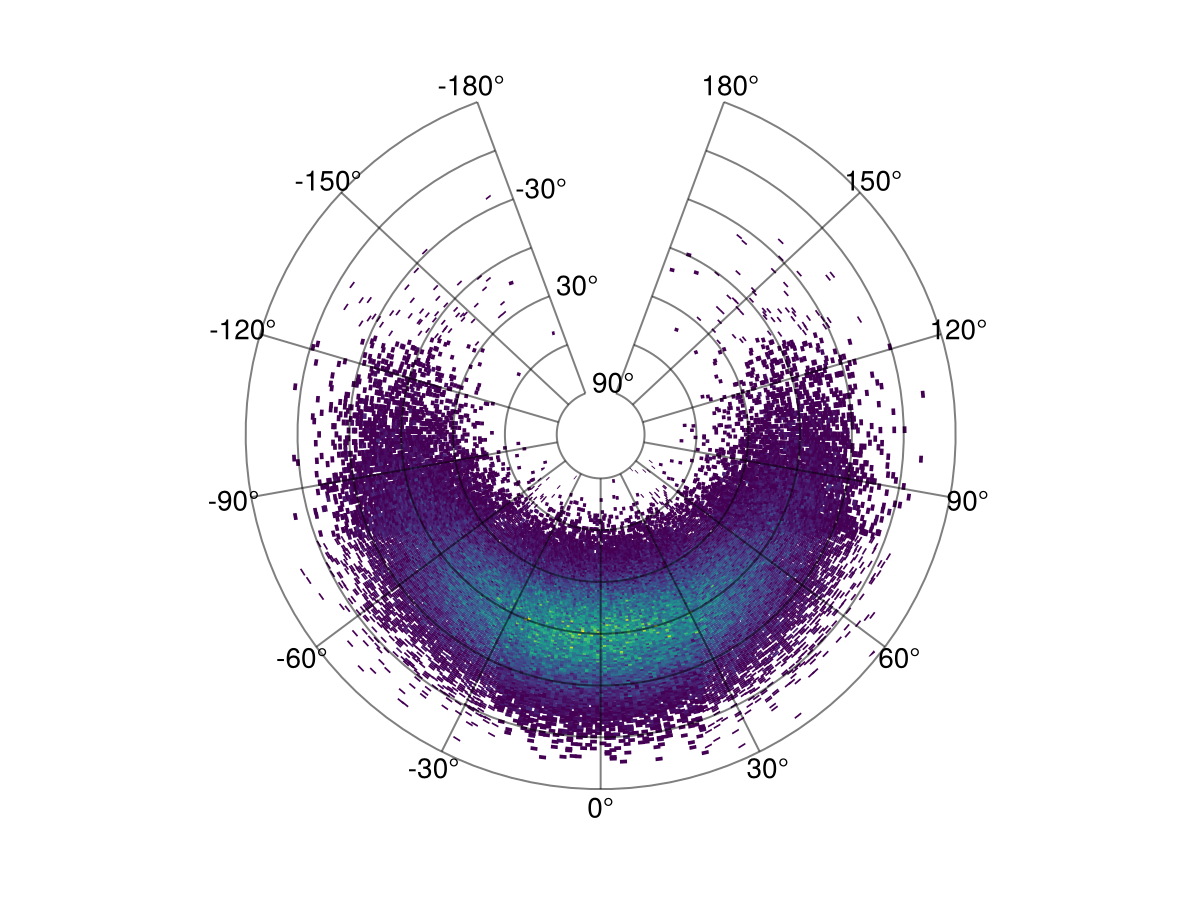
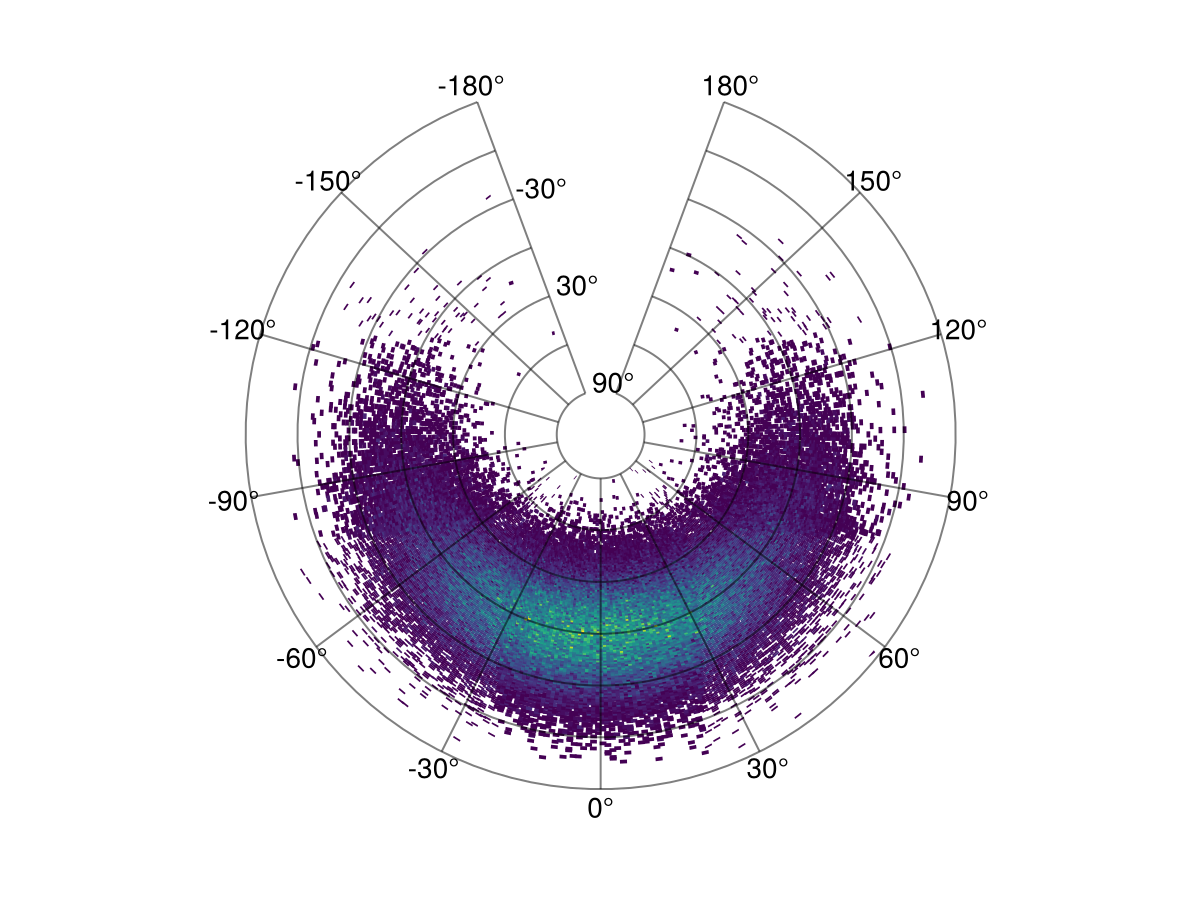
The projection can also be arbitrary!
julia
plot(h; axis = (; type = GeoAxis, dest = "+proj=tissot +lat_1=60 +lat_2=65"))
This page was generated using Literate.jl.