Histogram
You can use any Makie compatible recipe in GeoMakie, and this includes histograms! Until we get the datashader recipe working, you can also consider this a replacement for that if you use it with the correct nbins.
We use the excellent FHist.jl to create the histogram.
julia
using CairoMakie, GeoMakie
using FHist
import CairoMakie: Point2d
First, we generate random points in a normal distribution:
julia
random_data = randn(Point2d, 100_000)100000-element Vector{GeometryBasics.Point{2, Float64}}:
[-1.4207895168986935, -0.056872854645250624]
[-0.5003096385601675, 0.43588482907826337]
[0.6623326786581721, -0.9709619475455518]
[0.091417879332151, -0.37323654885310353]
[-0.7764351478724432, -1.311402610333022]
[-0.09889377311291497, 0.6926018114488206]
[0.266772072425327, -0.6915174617842921]
[3.477545579007632, 0.8568721262749817]
[0.0008101911886546859, -0.913976605339868]
[0.7197032139259302, 1.7026730447244238]
⋮
[0.7544967994778944, 0.7086699843865641]
[0.29534302267699886, 1.5160661790120322]
[0.7723089922884251, -0.941574666610009]
[-2.7857484236425454, 1.840023097333777]
[-1.794249408557778, -2.4436867484629143]
[1.8480850035424745, -1.9141073089732568]
[-0.5120626102516072, -0.2392009928963205]
[-0.23092123448840426, 0.4436499713920184]
[-0.2961242480330968, -0.42466617797360073]then, we rescale them to be within the lat/long bounds of the Earth:
julia
xmin, xmax = extrema(first, random_data)
ymin, ymax = extrema(last, random_data)
latlong_data = random_data .* (Point2d(1/(xmax - xmin), 1/(ymax - ymin)) * Point2d(360, 180),)
100000-element Vector{GeometryBasics.Point{2, Float64}}:
[-52.39751519779267, -1.1013543616509796]
[-18.450996138598157, 8.44099809438573]
[24.42626876339829, -18.802874984854043]
[3.371414037536078, -7.2278014453640935]
[-28.634271281470596, -25.395577446917674]
[-3.647118674525313, 13.412374509501227]
[9.838328304789574, -13.391375858386692]
[128.24893846683807, 16.593502463286477]
[0.029879165503216874, -17.699342278787487]
[26.542045560625457, 32.97260874225164]
⋮
[27.825203555571964, 13.723537936396731]
[10.892000775075752, 29.358928951632517]
[28.482102154833196, -18.233784331020907]
[-102.73604473353183, 35.63242035990068]
[-66.17040000319778, -47.32248936185733]
[68.1558111938365, -37.06707613949111]
[-18.884435789930652, -4.632175727433922]
[-8.516179736468278, 8.591371649738974]
[-10.920811705183397, -8.223746641068843]finally, we can create the histogram.
julia
h = Hist2D((first.(latlong_data), last.(latlong_data)); nbins = (360, 180))- edges: ([-209.0, -208.0, -207.0, -206.0, -205.0, -204.0, -203.0, -202.0, -201.0, -200.0 … 143.0, 144.0, 145.0, 146.0, 147.0, 148.0, 149.0, 150.0, 151.0, 152.0], [-87.0, -86.0, -85.0, -84.0, -83.0, -82.0, -81.0, -80.0, -79.0, -78.0 … 85.0, 86.0, 87.0, 88.0, 89.0, 90.0, 91.0, 92.0, 93.0, 94.0])
- bin counts: [0.0 0.0 … 0.0 0.0; 0.0 0.0 … 0.0 0.0; … ; 0.0 0.0 … 0.0 0.0; 0.0 0.0 … 0.0 0.0]
- maximum count: 35.0
- total count: 100000.0
This is what the histogram looks like without any projection,
julia
plot(h)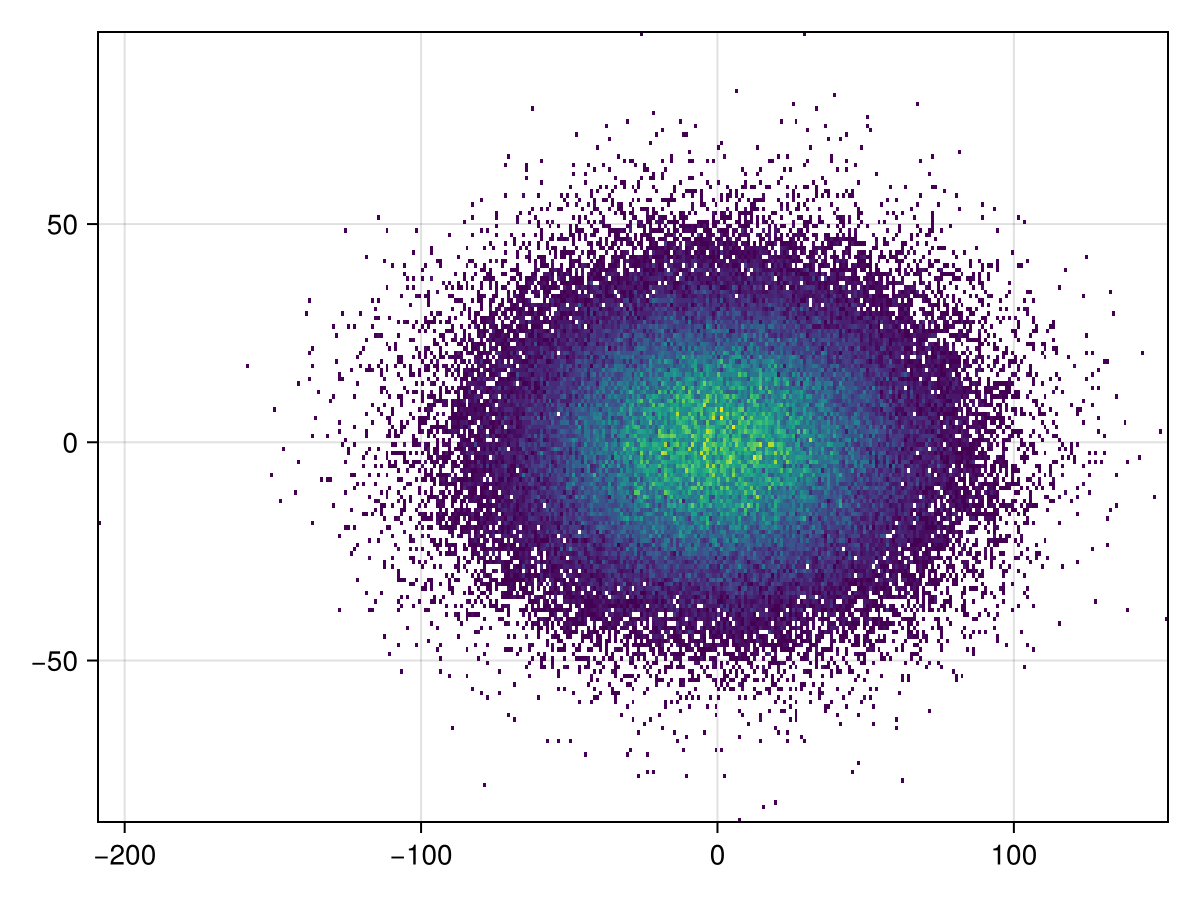
It's simple to plot to GeoAxis:
julia
plot(h; axis = (; type = GeoAxis))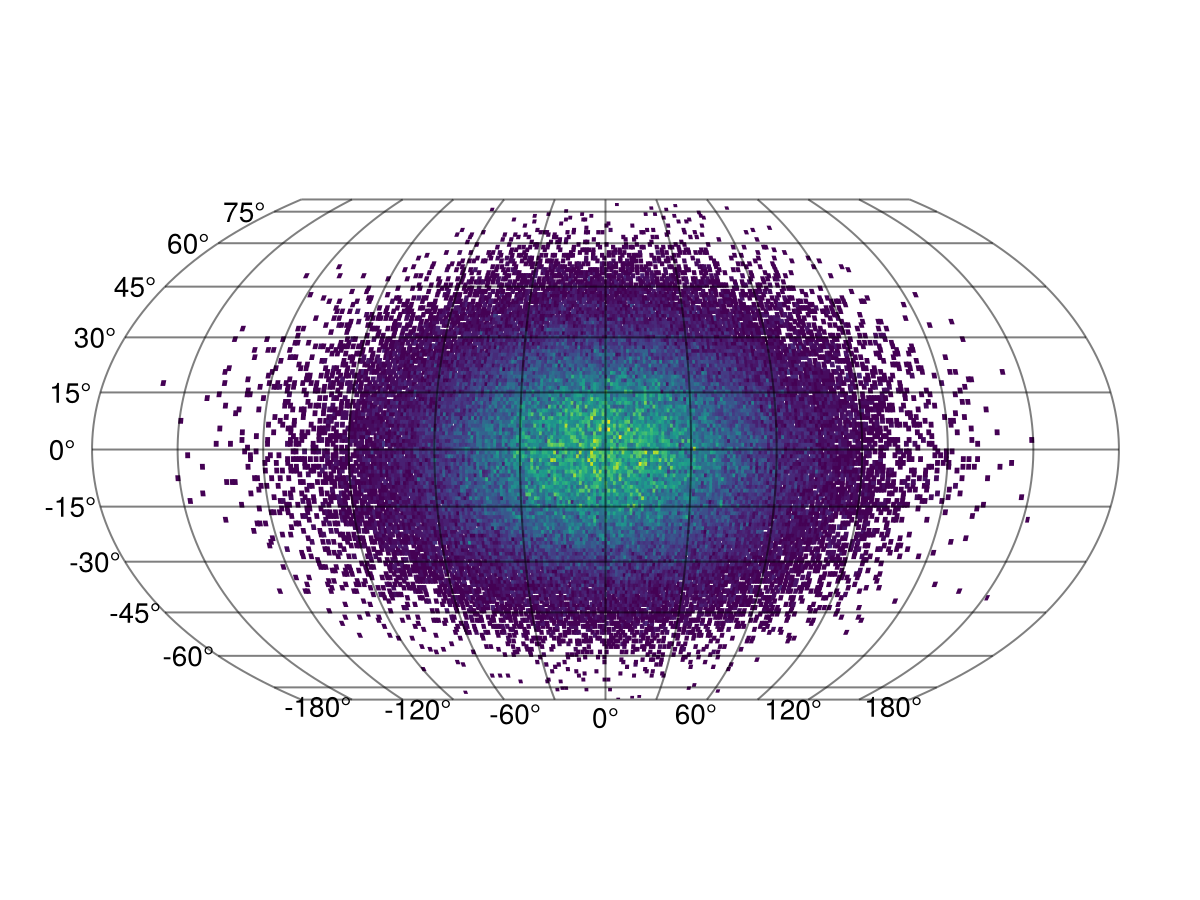
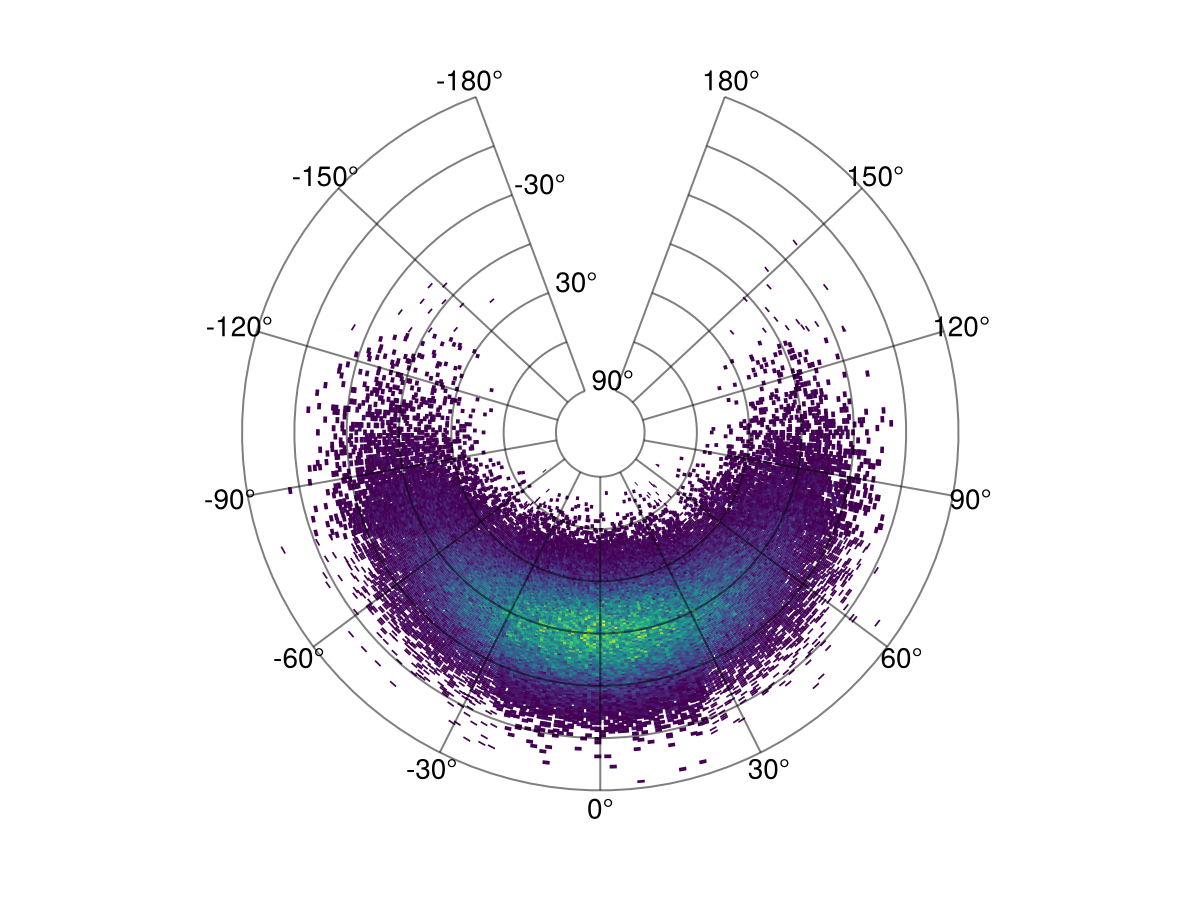
The projection can also be arbitrary!
julia
plot(h; axis = (; type = GeoAxis, dest = "+proj=tissot +lat_1=60 +lat_2=65"))
This page was generated using Literate.jl.