Histogram
You can use any Makie compatible recipe in GeoMakie, and this includes histograms! Until we get the datashader recipe working, you can also consider this a replacement for that if you use it with the correct nbins.
We use the excellent FHist.jl to create the histogram.
julia
using CairoMakie, GeoMakie
using FHist
import CairoMakie: Point2d
First, we generate random points in a normal distribution:
julia
random_data = randn(Point2d, 100_000)100000-element Vector{GeometryBasics.Point{2, Float64}}:
[-0.13371754710483966, 1.4642011855351331]
[-2.3257856312706227, -0.12168706188224121]
[0.2911575331449366, 0.9855691177005754]
[0.6456499523186708, 0.2670768660584365]
[-0.6815454847392947, -1.3769371073670194]
[-0.22676301905428392, 0.9065805915817088]
[-0.643806442654907, -1.815606161522863]
[-0.37308103427801176, 0.3704283729781061]
[1.1297686209314013, -0.1695634550280905]
[0.1448906718595217, -0.7780589050498815]
⋮
[0.8919661193829574, 0.016728444036192974]
[-0.6541286295928451, -1.0015840054616858]
[-0.08373055993550046, -0.7395701107095821]
[0.4494495448074116, -0.9433404626802178]
[-0.08144133566018089, -0.5718332045382727]
[0.3157656688630359, 1.199087423893553]
[1.0057835376400521, 0.3684174318142541]
[1.2139377839552785, 0.718367086456389]
[0.12642282168287136, -1.5554409649512067]then, we rescale them to be within the lat/long bounds of the Earth:
julia
xmin, xmax = extrema(first, random_data)
ymin, ymax = extrema(last, random_data)
latlong_data = random_data .* (Point2d(1/(xmax - xmin), 1/(ymax - ymin)) * Point2d(360, 180),)
100000-element Vector{GeometryBasics.Point{2, Float64}}:
[-5.04498783419097, 27.61702048393427]
[-87.74884425225733, -2.295199671897134]
[10.984992204483055, 18.589305063239696]
[24.359526667355258, 5.0374684528240525]
[-25.713818069529058, -25.971089680101702]
[-8.555471567813944, 17.09946352686418]
[-24.289973463402077, -34.24504299606104]
[-14.07585855298591, 6.986832182237248]
[42.62468966455742, -3.198219928449224]
[5.466535190373581, -14.675352629643433]
⋮
[33.652712887930946, 0.315523430916389]
[-24.679416050793495, -18.89136975743324]
[-3.159044309221471, -13.949396502713034]
[16.95714238504749, -17.792809580086555]
[-3.072674877020722, -10.785628012830426]
[11.913424919619496, 22.616579111424052]
[37.94689493702184, 6.948902829452447]
[45.80028189357557, 13.549475808134593]
[4.769767402733761, -29.33793894922183]finally, we can create the histogram.
julia
h = Hist2D((first.(latlong_data), last.(latlong_data)); nbins = (360, 180))- edges: ([-173.0, -172.0, -171.0, -170.0, -169.0, -168.0, -167.0, -166.0, -165.0, -164.0 … 179.0, 180.0, 181.0, 182.0, 183.0, 184.0, 185.0, 186.0, 187.0, 188.0], [-83.0, -82.0, -81.0, -80.0, -79.0, -78.0, -77.0, -76.0, -75.0, -74.0 … 89.0, 90.0, 91.0, 92.0, 93.0, 94.0, 95.0, 96.0, 97.0, 98.0])
- bin counts: [0.0 0.0 … 0.0 0.0; 0.0 0.0 … 0.0 0.0; … ; 0.0 0.0 … 0.0 0.0; 0.0 0.0 … 0.0 0.0]
- maximum count: 38.0
- total count: 100000.0
This is what the histogram looks like without any projection,
julia
plot(h)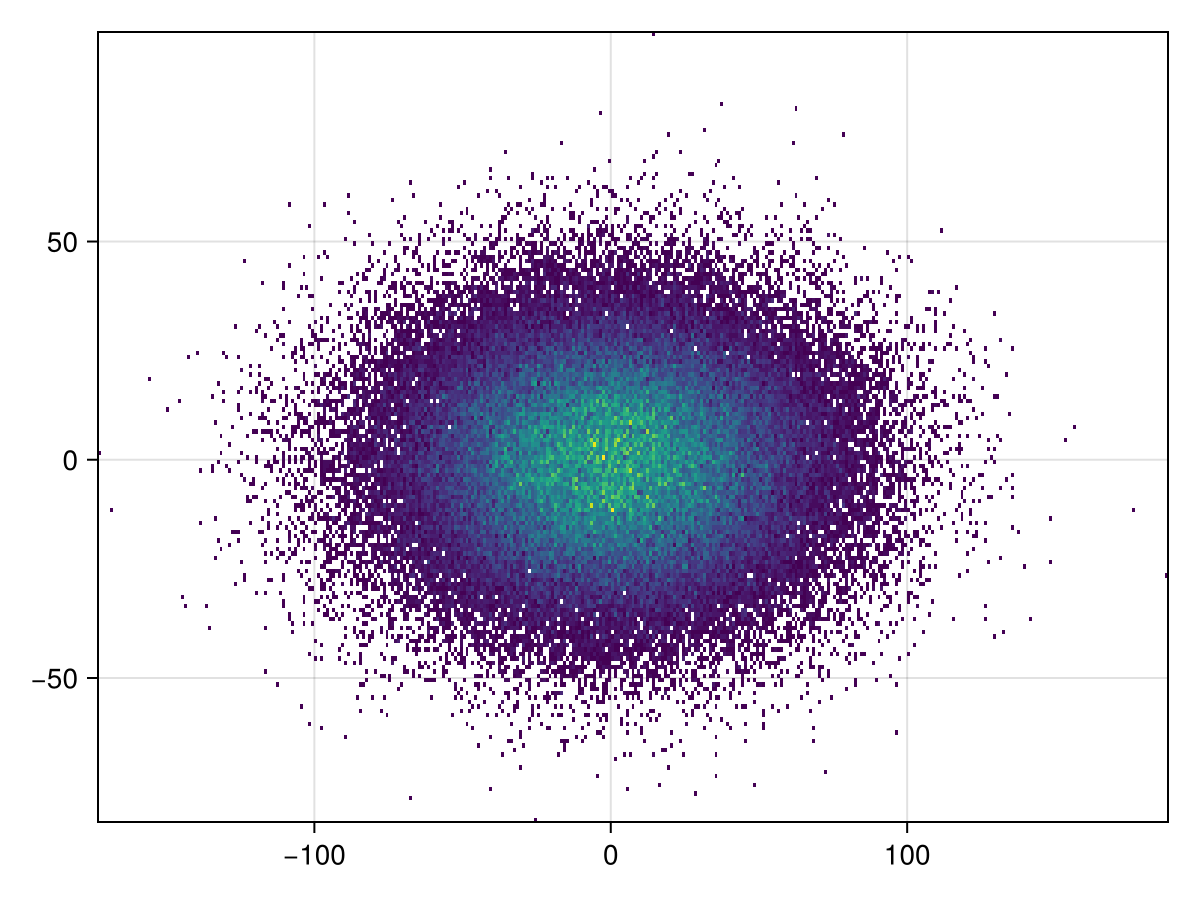
It's simple to plot to GeoAxis:
julia
plot(h; axis = (; type = GeoAxis))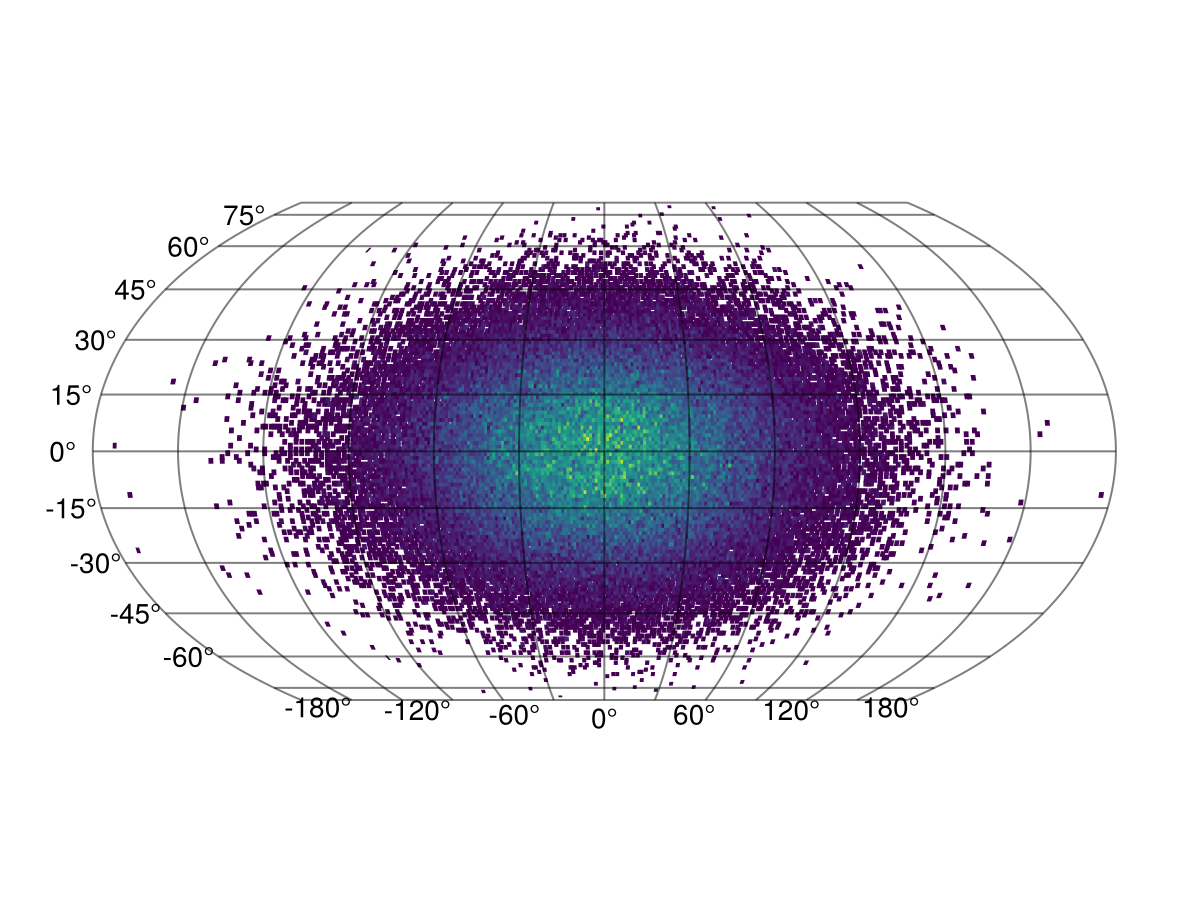
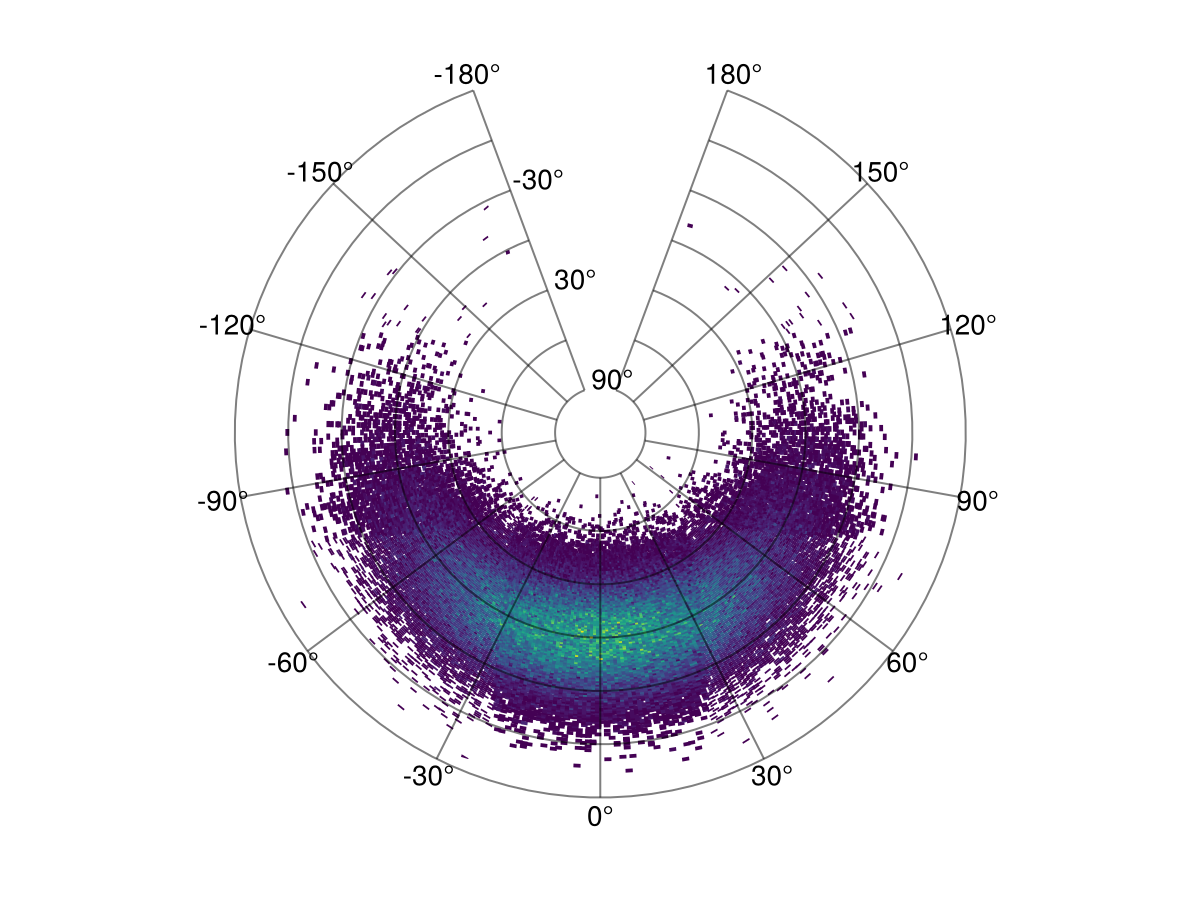
The projection can also be arbitrary!
julia
plot(h; axis = (; type = GeoAxis, dest = "+proj=tissot +lat_1=60 +lat_2=65"))
This page was generated using Literate.jl.