Histogram

You can use any Makie compatible recipe in GeoMakie, and this includes histograms! Until we get the datashader recipe working, you can also consider this a replacement for that if you use it with the correct nbins.
We use the excellent FHist.jl to create the histogram.
julia
using CairoMakie, GeoMakie
using FHist
import CairoMakie: Point2d
First, we generate random points in a normal distribution:
julia
random_data = randn(Point2d, 100_000)100000-element Vector{GeometryBasics.Point{2, Float64}}:
[1.2440882736543395, -1.3869999222435232]
[0.5349029660766883, 0.013495170796846442]
[1.7217432977068505, -0.5560430432560269]
[0.5541478654678501, -1.0264715750797122]
[0.11181404459881629, 0.20881758916986923]
[-0.5431203751563629, -0.053397428035652506]
[1.1853303737953702, 0.7032301779840194]
[0.5196011804463855, 0.11149218877006149]
[-1.6975248516243566, 0.2146562729533134]
[1.8221778788368355, -0.20786912228628976]
⋮
[1.3020503845341398, 0.23915831152885317]
[-1.0607073297040521, -1.159833638572563]
[-0.13678311458795445, -0.13673318139002222]
[0.6915446233379521, -1.6491144975019942]
[0.6507558941560591, 1.2865896494729077]
[-0.9094428662144259, 1.901407651859167]
[-0.24596918232081733, -0.1536830310412617]
[0.3589706404684645, 0.3312772702652447]
[0.46046846302630484, 0.4018224746033824]then, we rescale them to be within the lat/long bounds of the Earth:
julia
xmin, xmax = extrema(first, random_data)
ymin, ymax = extrema(last, random_data)
latlong_data = random_data .* (Point2d(1/(xmax - xmin), 1/(ymax - ymin)) * Point2d(360, 180),)
100000-element Vector{GeometryBasics.Point{2, Float64}}:
[51.438156473369304, -26.88238759461206]
[22.116133597419246, 0.26155907163246406]
[71.1873128538357, -10.77704790633124]
[22.911834487106976, -19.894742814051813]
[4.623070921728034, 4.047235532325642]
[-22.455891139546377, -1.0349318222656578]
[49.00874843939246, 13.629781739436368]
[21.483464951438453, 2.160905840167896]
[-70.18597537199132, 4.160399028582396]
[75.33988772243933, -4.028852651421226]
⋮
[53.83466176330689, 4.635289680905121]
[-43.856075773065335, -22.479523551049304]
[-5.655443749520356, -2.6501186627504425]
[28.592649972567916, -31.962608215603687]
[26.906196464051817, 24.936267895676355]
[-37.60188520909136, 36.852473207035175]
[-10.169858165032606, -2.97863521180546]
[14.842023966293548, 6.420709790776592]
[19.03855968566087, 7.787994312964156]finally, we can create the histogram.
julia
h = Hist2D((first.(latlong_data), last.(latlong_data)); nbins = (360, 180))- edges: ([-181.0, -180.0, -179.0, -178.0, -177.0, -176.0, -175.0, -174.0, -173.0, -172.0 … 171.0, 172.0, 173.0, 174.0, 175.0, 176.0, 177.0, 178.0, 179.0, 180.0], [-98.0, -97.0, -96.0, -95.0, -94.0, -93.0, -92.0, -91.0, -90.0, -89.0 … 74.0, 75.0, 76.0, 77.0, 78.0, 79.0, 80.0, 81.0, 82.0, 83.0])
- bin counts: [0.0 0.0 … 0.0 0.0; 0.0 0.0 … 0.0 0.0; … ; 0.0 0.0 … 0.0 0.0; 0.0 0.0 … 0.0 0.0]
- maximum count: 38.0
- total count: 100000.0
This is what the histogram looks like without any projection,
julia
plot(h)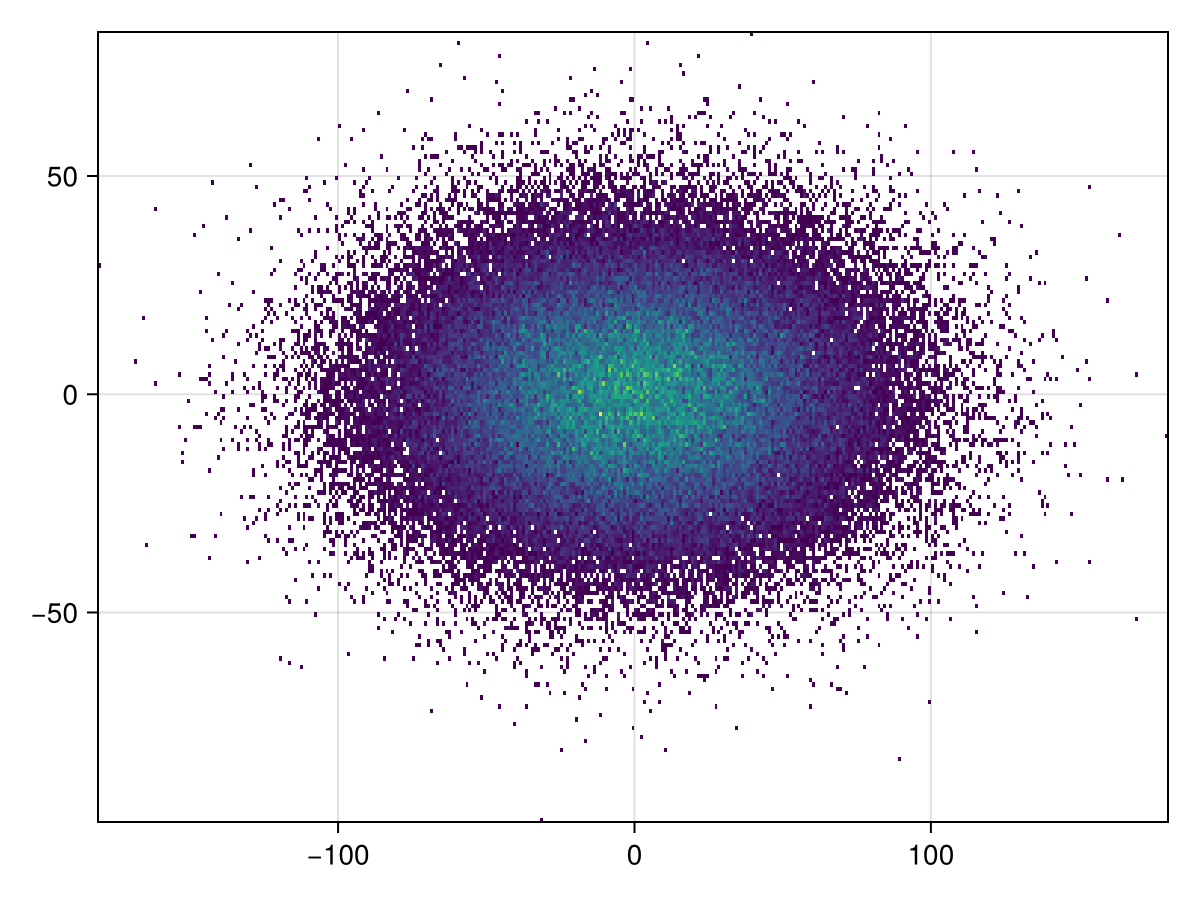
It's simple to plot to GeoAxis:
julia
plot(h; axis = (; type = GeoAxis))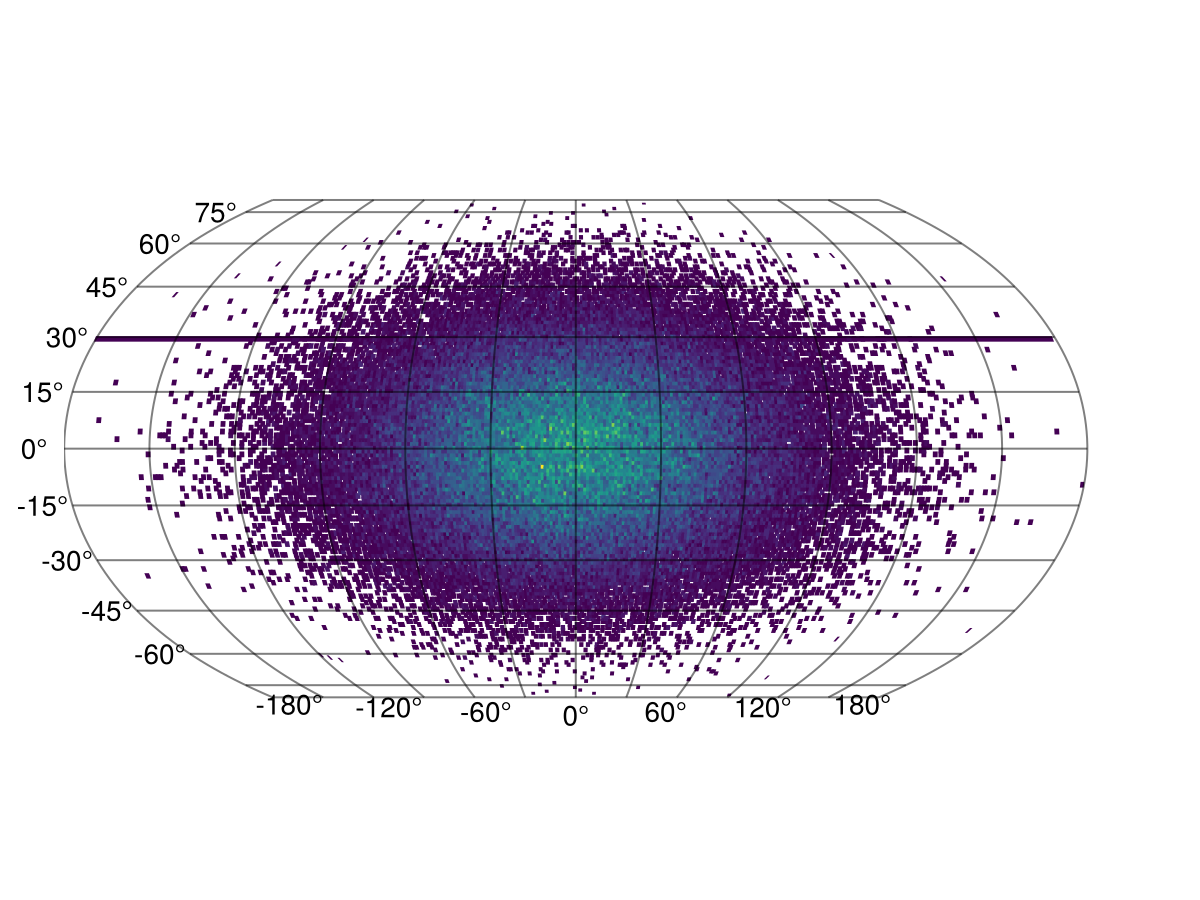
The projection can also be arbitrary!
julia
plot(h; axis = (; type = GeoAxis, dest = "+proj=tissot +lat_1=60 +lat_2=65"))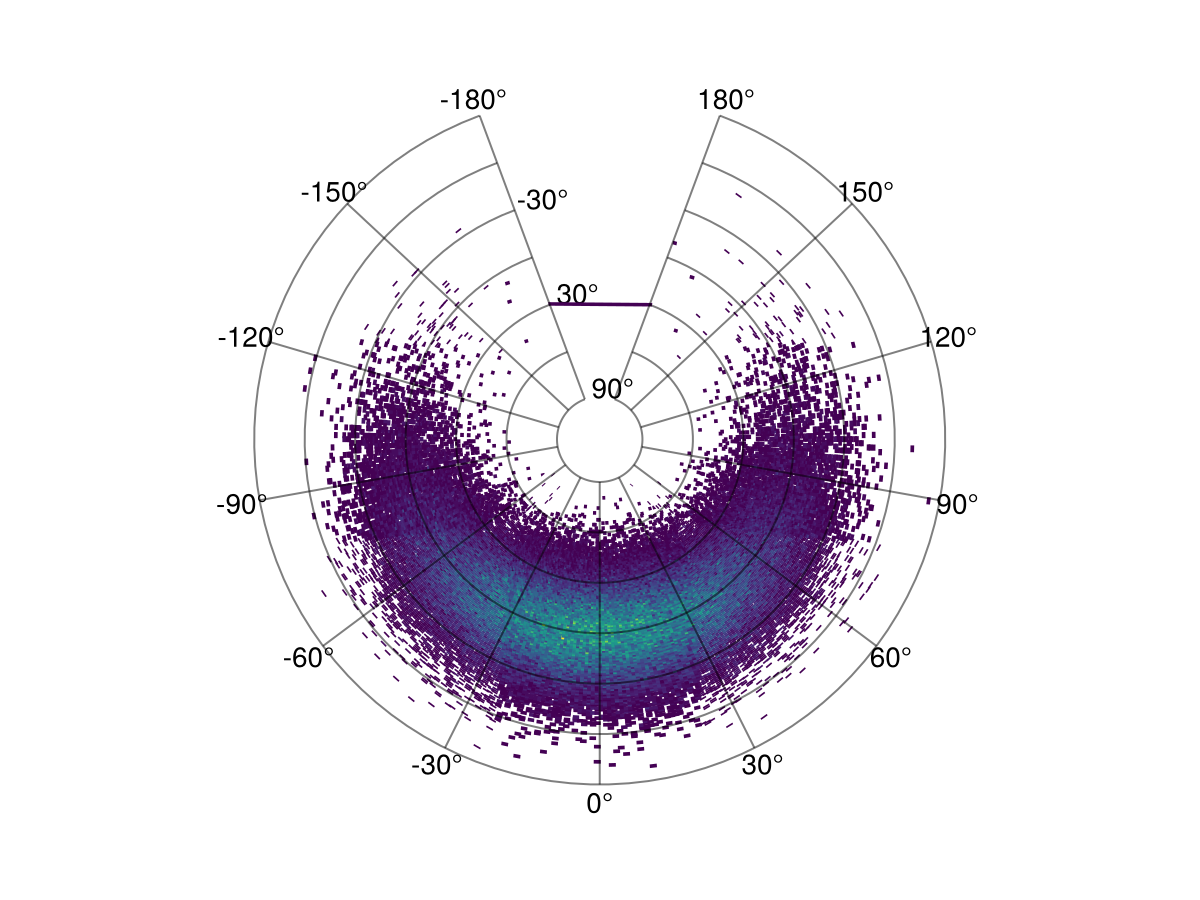
This page was generated using Literate.jl.