Histogram
You can use any Makie compatible recipe in GeoMakie, and this includes histograms! Until we get the datashader recipe working, you can also consider this a replacement for that if you use it with the correct nbins.
We use the excellent FHist.jl to create the histogram.
julia
using CairoMakie, GeoMakie
using FHist
import CairoMakie: Point2d
First, we generate random points in a normal distribution:
julia
random_data = randn(Point2d, 100_000)100000-element Vector{GeometryBasics.Point{2, Float64}}:
[0.6306588954241039, 1.2426168883300512]
[-1.187561188904902, 0.17966293828005578]
[-0.5596449240141085, -0.6694316593988948]
[1.7311622011897503, -1.451019753527686]
[0.4844138409489359, 0.44801258503706304]
[0.012133788941905714, 1.3446090483324438]
[-1.9833068235293192, 0.22954543233817207]
[1.22652867675813, 0.05071849447210646]
[0.07227953630954284, 1.0629532761977543]
[0.21650551273276925, 0.4936672533859396]
⋮
[-1.5840277954180937, -0.5890427494116284]
[0.3066278064561725, -0.7808089267684106]
[-1.404268020062232, -2.317890867138555]
[-1.3365736152806185, -1.2156901453952667]
[-1.9420189642374819, 2.047659116553842]
[-1.676075765511876, -1.0050068627694408]
[-1.7110849290924195, -0.9885806855851693]
[-1.2032462020642936, -0.7178210655689867]
[2.0343367203313965, 1.0631645724235665]then, we rescale them to be within the lat/long bounds of the Earth:
julia
xmin, xmax = extrema(first, random_data)
ymin, ymax = extrema(last, random_data)
latlong_data = random_data .* (Point2d(1/(xmax - xmin), 1/(ymax - ymin)) * Point2d(360, 180),)
100000-element Vector{GeometryBasics.Point{2, Float64}}:
[24.830295913320867, 23.34213806726891]
[-46.75664761036024, 3.3749075441427463]
[-22.034334519793678, -12.575047359359184]
[68.15930139317354, -27.256915420403953]
[19.072337047084343, 8.415764918391762]
[0.4777314205243892, 25.258026305158758]
[-78.08673701815393, 4.311933327696241]
[48.290875164137496, 0.9527297686440862]
[2.845789202476338, 19.967217865039668]
[8.524252947236636, 9.273372425599401]
⋮
[-62.36632699631827, -11.064968868053807]
[12.072547021538842, -14.667231665648634]
[-55.28882686465592, -43.54079616471389]
[-52.62356341622198, -22.836328306281132]
[-76.46115182260309, 38.46458410647834]
[-65.9904387819962, -18.87871408286069]
[-67.3688192309046, -18.57015389882201]
[-47.37419779632903, -13.484025991810725]
[80.09588562006132, 19.971186993193587]finally, we can create the histogram.
julia
h = Hist2D((first.(latlong_data), last.(latlong_data)); nbins = (360, 180))- edges: ([-191.0, -190.0, -189.0, -188.0, -187.0, -186.0, -185.0, -184.0, -183.0, -182.0 … 161.0, 162.0, 163.0, 164.0, 165.0, 166.0, 167.0, 168.0, 169.0, 170.0], [-85.0, -84.0, -83.0, -82.0, -81.0, -80.0, -79.0, -78.0, -77.0, -76.0 … 87.0, 88.0, 89.0, 90.0, 91.0, 92.0, 93.0, 94.0, 95.0, 96.0])
- bin counts: [0.0 0.0 … 0.0 0.0; 0.0 0.0 … 0.0 0.0; … ; 0.0 0.0 … 0.0 0.0; 0.0 0.0 … 0.0 0.0]
- maximum count: 36.0
- total count: 100000.0
This is what the histogram looks like without any projection,
julia
plot(h)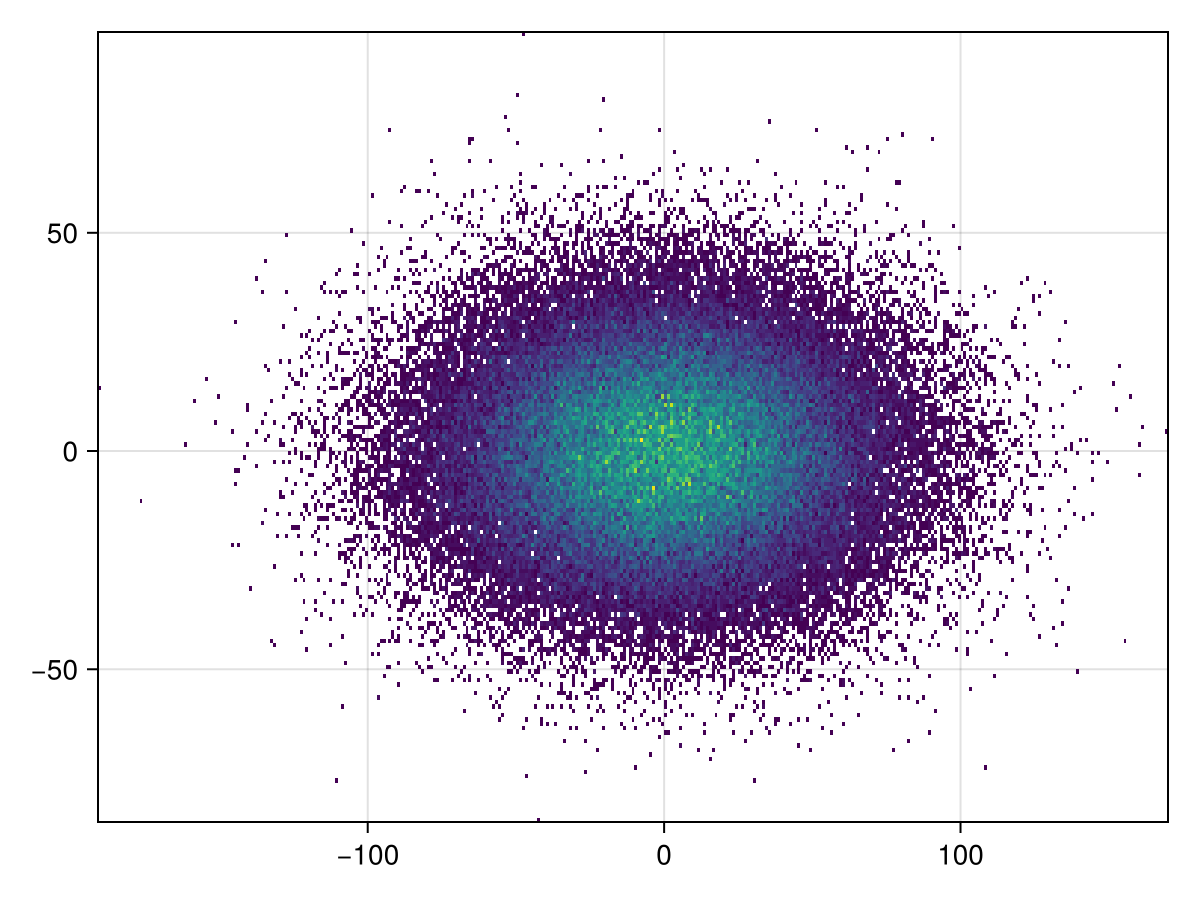
It's simple to plot to GeoAxis:
julia
plot(h; axis = (; type = GeoAxis))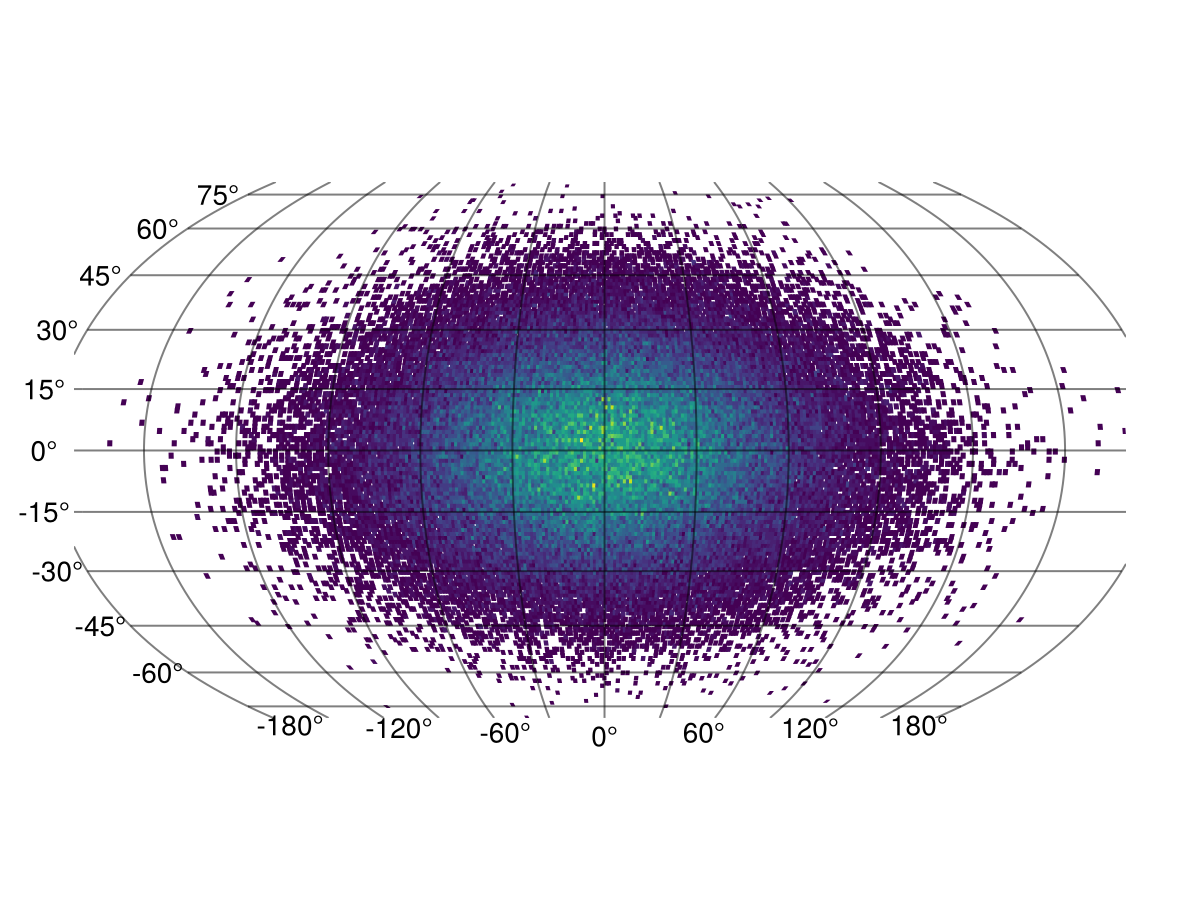
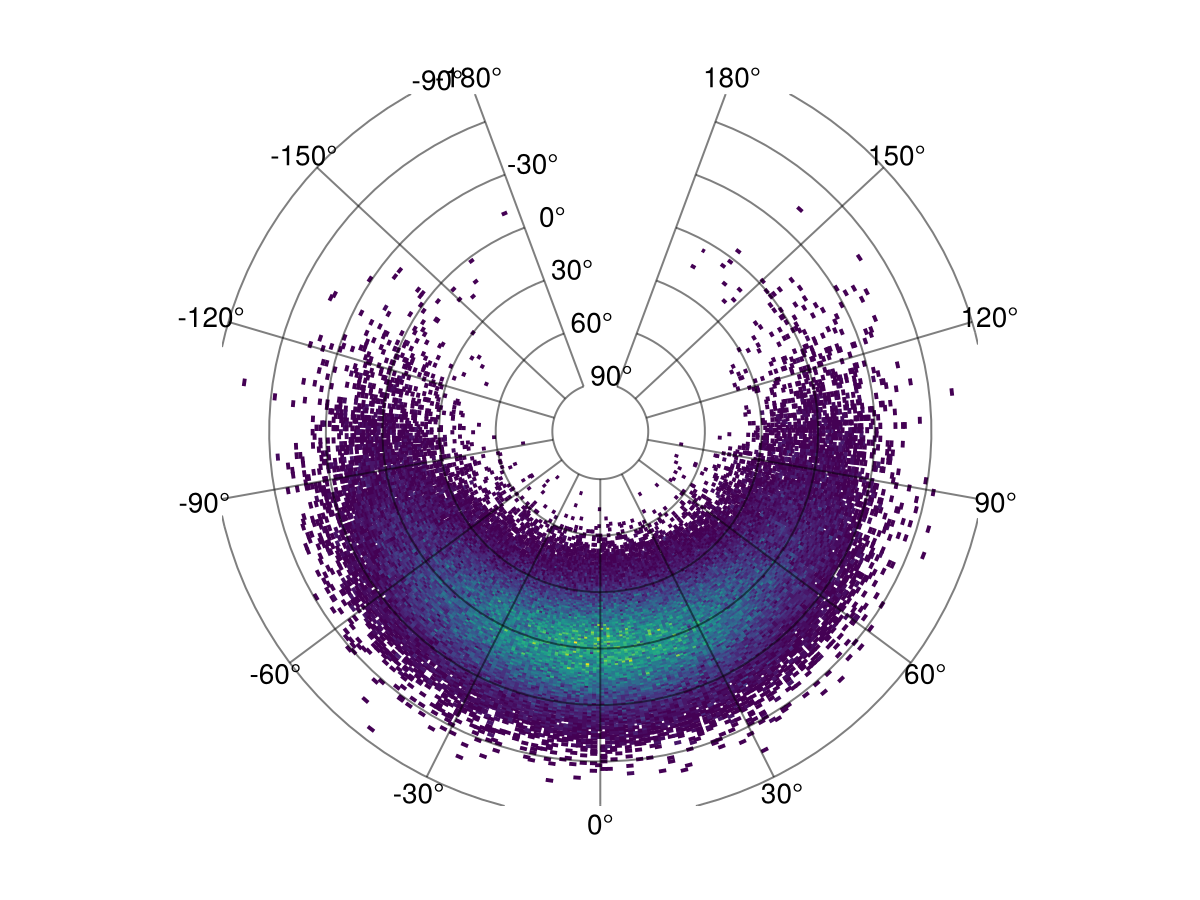
The projection can also be arbitrary!
julia
plot(h; axis = (; type = GeoAxis, dest = "+proj=tissot +lat_1=60 +lat_2=65"))
This page was generated using Literate.jl.