Histogram
You can use any Makie compatible recipe in GeoMakie, and this includes histograms! Until we get the datashader recipe working, you can also consider this a replacement for that if you use it with the correct nbins.
We use the excellent FHist.jl to create the histogram.
julia
using CairoMakie, GeoMakie
using FHist
import CairoMakie: Point2d
First, we generate random points in a normal distribution:
julia
random_data = randn(Point2d, 100_000)100000-element Vector{GeometryBasics.Point{2, Float64}}:
[0.63771723240377, 0.08547082681375878]
[0.938703199350046, 0.6954446405455669]
[0.4082305168901055, 0.6435009717179828]
[-1.118058868507838, 0.7598826657160064]
[0.3096162376971765, 0.8306974151535419]
[-0.802303829560218, -1.8844543114670058]
[-1.2026462356003547, 0.9076952734061782]
[1.1608077459023343, -0.7253327048290935]
[1.2409341849917075, 0.010674482542437002]
[1.6006126519058066, 0.19497549742369802]
⋮
[1.9582593457660917, -1.2280817388207939]
[-0.34362641079421385, -0.9296264472190975]
[-1.2797398795514716, 0.8107826460153764]
[1.3423623596752574, -0.8012238734026164]
[0.9392057471405757, -0.287533073409859]
[-1.248260735972698, -1.4476396668052818]
[0.46757857202719355, 1.0088043957686046]
[0.26019969448518726, 1.0846968558805314]
[-0.2750143174086106, 0.20553498157259872]then, we rescale them to be within the lat/long bounds of the Earth:
julia
xmin, xmax = extrema(first, random_data)
ymin, ymax = extrema(last, random_data)
latlong_data = random_data .* (Point2d(1/(xmax - xmin), 1/(ymax - ymin)) * Point2d(360, 180),)
100000-element Vector{GeometryBasics.Point{2, Float64}}:
[25.95566022922155, 1.7433437504500904]
[38.20605757597994, 14.184946057921554]
[16.615346196086932, 13.125453903676469]
[-45.505993303444846, 15.499284910838181]
[12.601657064881758, 16.943689457674076]
[-32.6544815516031, -38.43711087601044]
[-48.9487745995722, 18.514210534710937]
[47.245910747183714, -14.79457126015897]
[50.50712829424916, 0.21772683292506168]
[65.14636274585762, 3.9769044900567674]
⋮
[79.70290222174947, -25.049115636617028]
[-13.985901448425086, -18.961539479943895]
[-52.086554679130764, 16.53748900761492]
[54.635345482034836, -16.34251924871999]
[38.2265117193481, -5.8647962733419154]
[-50.80532545476474, -29.527426609875473]
[19.03086498110865, 20.576527738780086]
[10.59035967453472, 22.124502070778853]
[-11.193328042780026, 4.192285707078052]finally, we can create the histogram.
julia
h = Hist2D((first.(latlong_data), last.(latlong_data)); nbins = (360, 180))- edges: ([-187.0, -186.0, -185.0, -184.0, -183.0, -182.0, -181.0, -180.0, -179.0, -178.0 … 165.0, 166.0, 167.0, 168.0, 169.0, 170.0, 171.0, 172.0, 173.0, 174.0], [-89.0, -88.0, -87.0, -86.0, -85.0, -84.0, -83.0, -82.0, -81.0, -80.0 … 83.0, 84.0, 85.0, 86.0, 87.0, 88.0, 89.0, 90.0, 91.0, 92.0])
- bin counts: [0.0 0.0 … 0.0 0.0; 0.0 0.0 … 0.0 0.0; … ; 0.0 0.0 … 0.0 0.0; 0.0 0.0 … 0.0 0.0]
- maximum count: 32.0
- total count: 100000.0
This is what the histogram looks like without any projection,
julia
plot(h)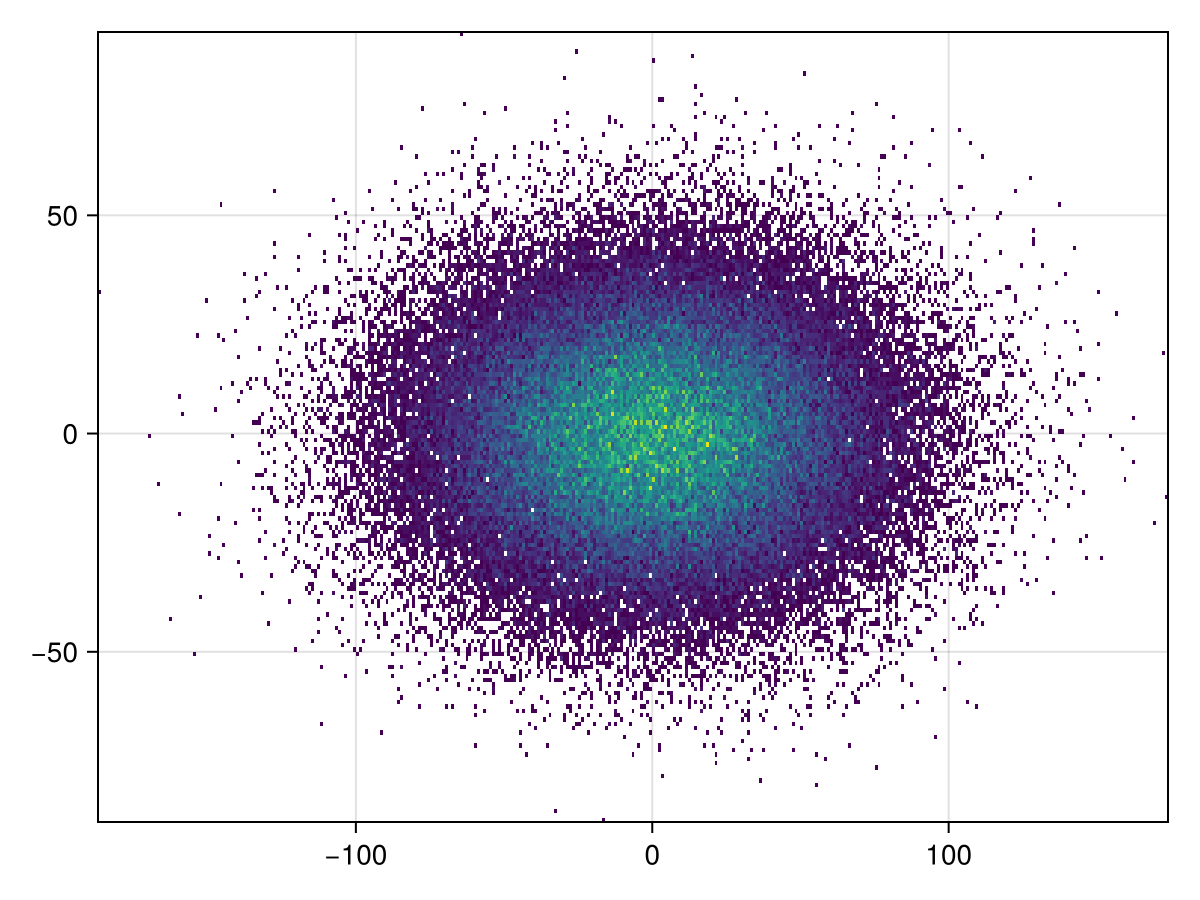
It's simple to plot to GeoAxis:
julia
plot(h; axis = (; type = GeoAxis))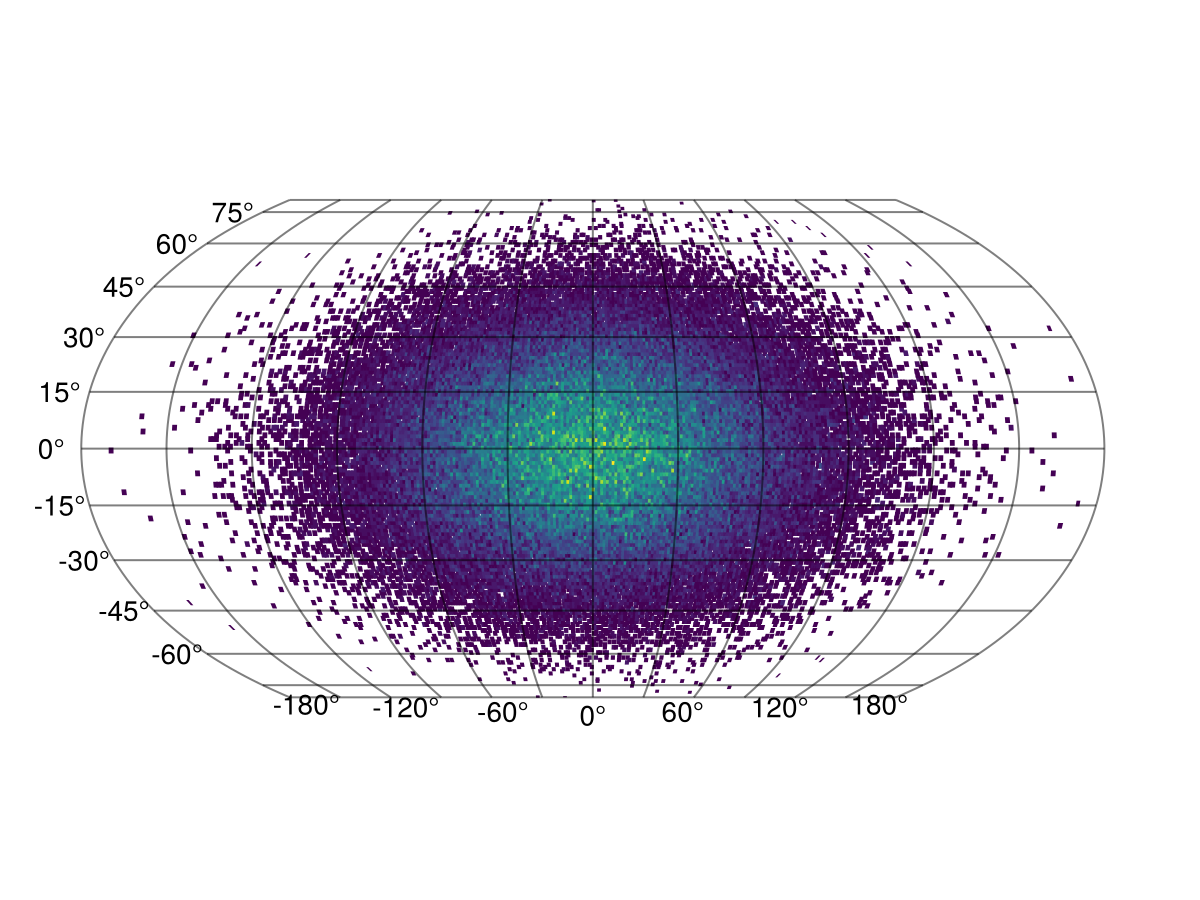
The projection can also be arbitrary!
julia
plot(h; axis = (; type = GeoAxis, dest = "+proj=tissot +lat_1=60 +lat_2=65"))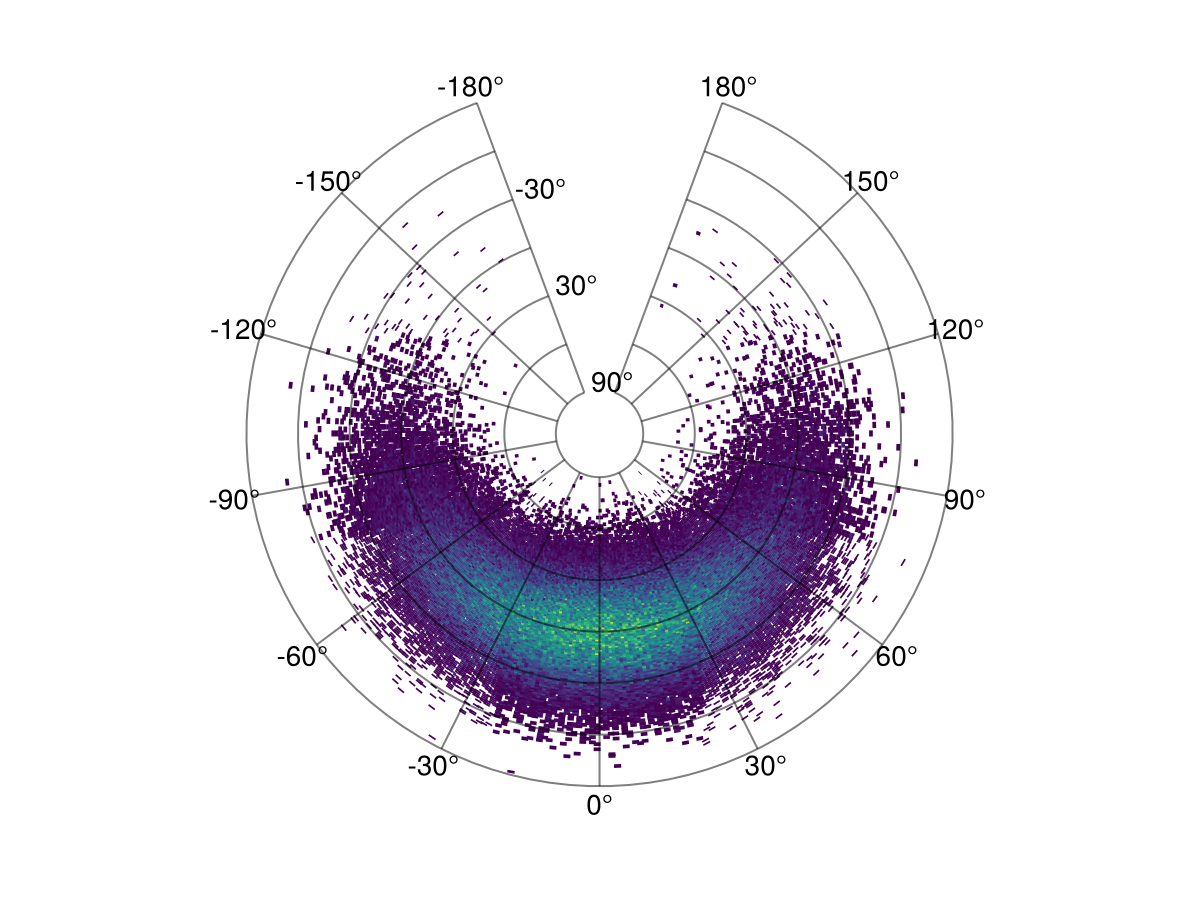
This page was generated using Literate.jl.